Assessment of Bone Mineral Density of Patients with Spinocerebellar Ataxia Type 3
Article information

Abstract
Objective
Machado-Joseph disease (MJD) is a spinocerebellar ataxia, and osteoporosis is a multifactor disease that may affect patients with neurologic conditions. The frequency of osteoporosis among MJD patients, however, has not been studied. The purpose of this study is to evaluate bone mineral density (BMD) and identify correlations between clinical factors and frequency of vertebral fractures in patients with MJD.
Methods
Clinical data, lumbar X-rays and BMD data were obtained in 30 patients with MJD.
Results
Ten patients (33.3%) showed low BMD in at least one of the sites studied based on Z-scores. The Z-score correlated directly with body mass index, and the femoral neck Z-score was inversely correlated with cytosine-adenine-guanine (CAG) expansion. There was no correlation between BMD and other clinical factors. Forty-three percent of the patients reported previous pathologic fractures. Five patients (16.7%) had at least one fracture detected by lumbar X-ray.
Conclusion
Low BMD and fractures are frequent among MJD patients, and careful management of BMD may be beneficial for these patients.
Machado-Joseph disease (MJD) is also known as spinocerebellar ataxia type 3 [1]. It is caused by an abnormal cytosine-adenine-guanine (CAG) expansion on chromosome 14q32.1 [2]. MJD occurs when more than 52 CAG repeats are present [3] and the larger the expansion, the younger patients will be at onset of disease [4].
MJD patients present with progressive ataxia, ophthalmoplegia, dysarthria and other neurologic changes that can lead to different grades of movement restriction [2].
Osteoporosis is the most common metabolic disease of the bone [5]. Several conditions are known to predispose individuals to loss of bone mineral density (BMD), including movement restriction and disuse [6].
The idea for this study emerged from clinical observations of the high frequency of pathologic fractures in patients with ataxia in our institution. Despite these observations and the fact that movement restriction as a risk factor for osteoporosis, BMD is not routinely assessed in patients with MJD before fractures are diagnosed.
The aim of this pilot study is to investigate the BMD and frequency of vertebral fractures in MJD patients and to determine clinical factors that may be related to changes in BMD.
PATIENTS AND METHODS
This prospective study was approved by the local Institutional Ethics Committee (#723.967). All patients gave their written informed consent prior to enrollment.
Patient recruitment and assessment
Thirty patients over the age of 18 years with genetically confirmed MJD were included in this study.
All patients underwent neurological evaluation and genetic expansion of CAG [7] was measured. A validated ataxia scale (Scale for Assessment and Rating of Ataxia, SARA) was applied. Weight and height of each patient were measured. A questionnaire was administered and information was collected regarding medications, fractures, family history of fractures and osteoporosis, frequency of falls, use of wheelchair and age of disease onset.
Bone mineral density measurement
BMD of the lumbar spine (L1–L4) and proximal femur was assessed by a dual energy X-ray absorptiometry scan using a Hologic Discovery QDR® WI densitometer (Hologic, Waltham, MA, USA).
BMDs were reported as Z-scores (standard deviation of the mean of control age-, gender- and race-matched population) [8]. According to the International Society for Clinical Densitometry (ISCD), a Z-score ≤ -2 was considered to be below the expected range for age.
An X-ray of the lumbar spine was performed in all patients to assess the presence of pathologic vertebral fractures.
Statistical analysis
Exploratory analysis of the data was performed using general measures (mean, standard deviation, minimum, median, maximum, frequency and percentage). Simple linear regression models and Pearson correlation (r) were used to evaluate the correlation between BMD and the clinical and laboratory variables, such as the age of onset, disease duration and severity, wheelchair dependence, falls, fractures, subtype of ataxia and genetic expansion. The correlation between BMD and these variables was calculated and the significance level adopted for this study was 5%.
Statistical Analysis System (SAS) for Windows version 9.4. (SAS Institute Inc, Cary, NC, USA) was used for all statistical analyses.
RESULTS
Demographics
There were 15 women in the study, 10 of which had already reached menopause. The mean age was 48.6 years and mean age of disease onset was 36.7 years. The mean disease duration was 11.5 years and mean body mass index (BMI) was 22.2.
Approximately 27% of the patients were in wheelchairs. Mean SARA score was 15.8 and mean CAG repeat length was 72.2 (Table 1).
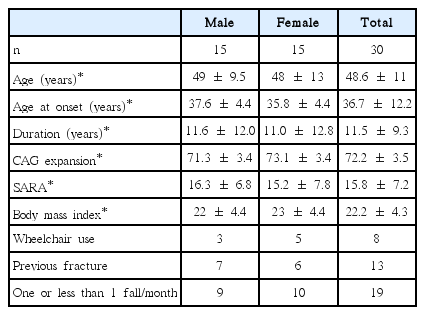
Demographic data of the patient population
Sixty-three percent of the patients reported one fall or less in a month; 13% had between two and 10; 20% had more than 10 and less than 30 falls and only 1 patient (3%) reported more than 30 falls per month.
Forty-three percent of the patients reported previous fractures that were classified as pathologic. Five patients (16.7%) had at least one fracture detected by lumbar X-ray. No patient was using medications that interfere with BMD.
Densitometry data
As degenerative alterations may lead to overestimation of BMD, the lumbar spine scans of 5 patients were excluded from the analyses. Among the remaining 25 patients, nine (36%) showed low BMD (Z-score of -2.0 or less). Two patients (6%) had low BMD in the total femur analysis and four (13.3%) in the femoral neck.
The mean Z-score values were negative in all sites: lumbar spine Z-score = -0.96; total femur = -0.78 and femoral neck = -0.24. Ten patients (33.3%) had Z-scores less than -2.0 in at least one of the three regions studied.
Applying WHO criteria to our patient population, 66.6% would be classified as presenting with osteopenia or osteoporosis (23% with lumbar spine osteopenia and 30% with osteoporosis), 43% with femoral neck osteopenia (10% osteoporosis), and 50% with total femoral osteopenia (13% osteoporosis).
Statistical analysis
BMI correlated with BMD Z-scores of all three regions measured in the patient cohort (Table 2): lumbar spine (r = 0.45, p = 0.01), total femur (r = 0.34, p = 0.0005), and femoral neck (r = 0.32, p = 0.002). BMD did not correlate with the age at onset, disease duration, SARA scores, wheelchair dependence, history of fractures, frequency of falls or the presence of fractures.

Correlations between the Z-score of the lumbar spine, the femoral neck and the total femur sites with the variables of interest
Femoral neck and total femur Z-scores showed a direct correlation with presence of menopause (p = 0.01 and p = 0.0079, respectively) and only femoral neck Z-score was inversely correlated to the CAG expansion (r = -0.39, p = 0.04).
DISCUSSION
Our results showed that 33.3% of the patients had low BMD in at least one site (lumbar spine, femoral neck or total femur). This is a high frequency of abnormally low BMD and suggests the possibility of secondary BMD loss. Our results also showed that 66.6% of our population would have osteopenia or osteoporosis if T-score were applied.
As expected in MJD patients, our study population included both young adults and elderly patients. According to the ISCD [9], osteoporosis may be diagnosed in postmenopausal women and in men aged 50 and older using T-score. For BMD reporting in premenopausal females and in males younger than 50 years of age, the Z-score is preferred. The Z-score is also a useful indicator of possible secondary osteoporosis. We chose to analyze Z-scores because our patient population was heterogeneous in age.
Eigentler et al. [10] performed a similar study, evaluating 28 patients with Friedreich’s Ataxia (FA). The authors found that 21% of the patients had low BMD in at least one of examined sites, also based on the Z-score.
We found lumbar vertebrae fractures by X-ray scans in five (16.7%) patients and seven patients (23%) reported more than 10 falls per month. The finding of high frequency of falls and low BMD increases the risk of fractures in this population [11].
The known relationship between low BMI and osteoporosis was confirmed in our study. Mean and median BMI of our patients were both 22, which is considered normal according to the World Health Organization. Using this classification, 70% (21 patients) would be considered normal (18.5 ≤ BMI < 25) and only 20% (six patients) would be classified as overweight (25 ≤ BMI).
A local city survey (ISACamp-2009) taken where the study was conducted, however, showed that 62.9% of the population is overweight (25 ≤ BMI) [12,13]. The difference between the proportion of overweight adults in our study compared to the general population of the city where the study was conducted may be related to the disease itself.
As expected, a correlation between menopause and low BMD was observed.
We found a significant correlation between CAG expansion and low femoral neck Z-score. Eigentler et al. [10] also found a significant correlation between GAA repeat length in patients with FA and a low femoral neck Z-score. Similar findings in two different types of ataxia supports the possibility that the gene alteration may indeed be related to lower BMD at this site in ataxic patients.
Surprisingly, the age of disease onset, the duration of symptoms and the severity of ataxia (assessed by the SARA score) did not correlate with Z-scores in this cohort.
Although the association of some neurologic diseases and osteoporosis is already recognized [6], ataxia is not widely accepted as a direct risk factor. As a consequence, patients with MJD and other ataxias are not routinely assessed or treated for osteopenia or osteoporosis until a pathologic fracture occurs.
In conclusion, low BMD is common among MJD patients, especially if the patients have a long CAG repeat and low BMI. Careful management of BMD may be beneficial for these patients and the impact of low BMD on health-related consequences in MJD patients needs to be further investigated.
Notes
Conflicts of Interest
The authors have no financial conflicts of interest.