ABSTRACT
-
Objective
Brainstem segmentation has been useful in identifying potential imaging biomarkers for diagnosis and progression in atypical parkinsonian syndromes (APS). However, the majority of work has been performed using manual segmentation, which is time consuming for large cohorts.
-
Methods
We investigated brainstem involvement in APS using an automated method. We measured the volume of the medulla, pons, superior cerebellar peduncle (SCP) and midbrain from T1-weighted MRIs in 67 patients and 42 controls. Diagnoses were corticobasal syndrome (CBS, n = 14), multiple system atrophy (MSA, n = 16: 8 with parkinsonian syndrome, MSA-P; 8 with cerebellar syndrome, MSA-C), progressive supranuclear palsy with a Richardson’s syndrome (PSP-RS, n = 12), variant PSP (n = 18), and APS not otherwise specified (APS-NOS, n = 7).
-
Results
All brainstem regions were smaller in MSA-C (19–42% volume difference, p < 0.0005) and in both PSP groups (18–33%, p < 0.0005) than in controls. MSA-P showed lower volumes in all regions except the SCP (15–26%, p < 0.0005). The most affected region in MSA-C and MSA-P was the pons (42% and 26%, respectively), while the most affected regions in both the PSP-RS and variant PSP groups were the SCP (33% and 23%, respectively) and midbrain (26% and 24%, respectively). The brainstem was less affected in CBS, but nonetheless, the pons (14%, p < 0.0005), midbrain (14%, p < 0.0005) and medulla (10%, p = 0.001) were significantly smaller in CBS than in controls. The brainstem was unaffected in APS-NOS.
-
Conclusion
Automated methods can accurately quantify the involvement of brainstem structures in APS. This will be important in future trials with large patient numbers where manual segmentation is unfeasible.
-
Keywords: Brainstem; Magnetic resonance imaging; Parkinsonian syndromes
Progressive supranuclear palsy (PSP) [
1], corticobasal syndrome (CBS) [
2] and multiple system atrophy (MSA) [
3] are a group of neurodegenerative disorders characterized as “atypical” parkinsonian disorders due to shared features of rigidity and bradykinesia and features that are atypical for Parkinson’s disease. These additional clinical features include supranuclear gaze palsy and frequent falls (PSP), dystonia and apraxia (CBS), and autonomic features and ataxia (MSA), but nonetheless, there are a number of patients who have overlapping features or who do not fulfill the diagnostic criteria for a specific condition (atypical parkinsonian syndrome not otherwise specified, APS-NOS) [
4]. Accurate diagnosis is particularly challenging early in the disease course.
For all these conditions, there are currently no curative treatments, and patients usually do not respond as well to levodopa therapy as those with idiopathic Parkinson’s disease. However, potential disease-modifying therapies are in development; therefore, it is critical to develop improved methods for diagnosing these conditions as early as possible and tracking their progression to inform the design of treatment trials.
Brainstem segmentation has been useful in identifying potential imaging biomarkers for both diagnosis and progression in parkinsonian disorders [
5]. However, the majority of work has been performed using either qualitative measures (such as visual assessment) or manual segmentation, which is time consuming for large cohorts. Here, we investigated differential involvement in the brainstem in atypical parkinsonism using a customized automated segmentation tool.
MATERIALS & METHODS
As part of the University College London (UCL) arm of the PROgressive Supranuclear Palsy CorTico-Basal Syndrome Multiple System Atrophy Longitudinal (PROSPECT) study and the University College London Longitudinal Investigation of FTD (UCL LIFTD) study, we recruited a consecutive series of patients with a diagnosis of atypical parkinsonism, including those with a T1-weighted MRI scan passing standard quality control protocols.
A total of 67 patients were identified. Diagnoses in the patient group were CBS (
n = 14) [
2], MSA (
n = 16: 8 with parkinsonian syndrome, MSA-P; 8 with cerebellar syndrome, MSA-C) [
3], PSP with a Richardson’s syndrome (PSP-RS,
n = 12), variant PSP (
n = 18: 7 with predominant CBS, PSP-CBS; 3 with predominant parkinsonism, PSP-P; 3 with predominant frontal presentation, PSPF; 3 with predominant speech/language disorder, PSP-SL; 2 with progressive gait freezing, PSP-PGF) [
1] and APS-NOS (
n = 7) [
4]. Forty-two cognitively normal subjects enrolled in the same studies, with a similar age as the patients and with a usable volumetric T1-weighted MRI, were identified as controls. The study was approved by the local ethics committee (14/LO/1575 and 16/LO/0465), and written informed consent was obtained from all participants.
No significant age difference was seen between the patient group and controls [patients: 67.1 (9.5) years, controls: 65.3 (7.4);
p = 0.279,
t-test]. However, there was a significant difference in gender distribution (patients: 63% male, controls: 43% male;
p = 0.043, chi-squared test). In the clinical groups, there was no difference in gender (
p = 0.089, chi-squared test), but there was a significant difference in age, with the MSA-P group being the youngest [59.0 (10.8) years] and the APS-NOS and variant PSP groups being the oldest [72.5 (8.9) and 74.7 (5.5) years, respectively]. Disease duration was also different (
p = 0.006, ANOVA), with those in the PSP-RS group having the shortest disease duration [2.7 (1.1) years] and those in the variant PSP group having the longest disease duration [5.7 (2.1) years] (
Table 1).
T1-weighted MRI scans were acquired with a 3T Siemens scanner (Siemens, Erlangen, Germany): after 9 scans, the scanner was upgraded from a Trio (TR = 2,200 ms, TI = 900 ms, TE = 2.9 ms, acquisition matrix = 256 × 256, spatial resolution = 1.1 mm, acquisition plane = sagittal) to a Prisma (TR = 2,000 ms, TI = 850 ms, TE = 2.93 ms, acquisition matrix = 256 × 256, spatial resolution = 1.1 mm, acquisition plane=sagittal). Volumetric MRI scans were first bias field corrected and whole-brain parcellated using the geodesic information flow (GIF) algorithm [
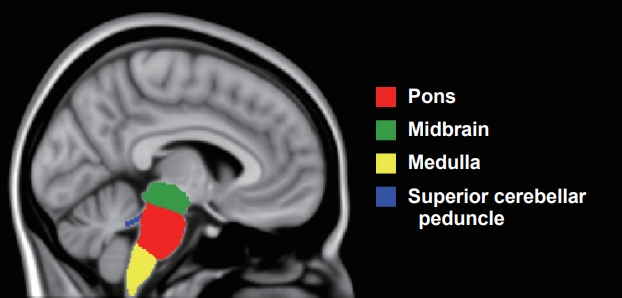
6], which is based on atlas propagation and label fusion. The volumes of the whole brainstem and medulla, pons, superior cerebellar peduncle (SCP) and midbrain (
Figure 1) were subsequently segmented using a customized version of the module available in FreeSurfer (
https://surfer.nmr.mgh.harvard.edu/fswiki/BrainstemSubstructures) [
7] to accept the GIF parcellation as input for FreeSurfer. Volumes were expressed as a percentage of the total intracranial volume (TIV), computed with SPM12 v6470 (Statistical Parametric Mapping, Wellcome Trust Centre for Neuroimaging, London, UK) running under MATLAB R2014b (Math Works, Natick, MA, USA) [
8]. All segmentations were visually checked for quality.
Statistical analyses were performed on the volumetric measures in SPSS software (IBM Corp., Armonk, NY, USA) v22.0. Groups were compared using an ANOVA test adjusting for scanner type, TIV, gender and age. The results were corrected for multiple comparisons (Bonferroni’s correction) at p < 0.0045. To assess the accuracy of the brainstem volume in discriminating between different diagnoses, we performed a receiver operating characteristic analysis.
RESULTS
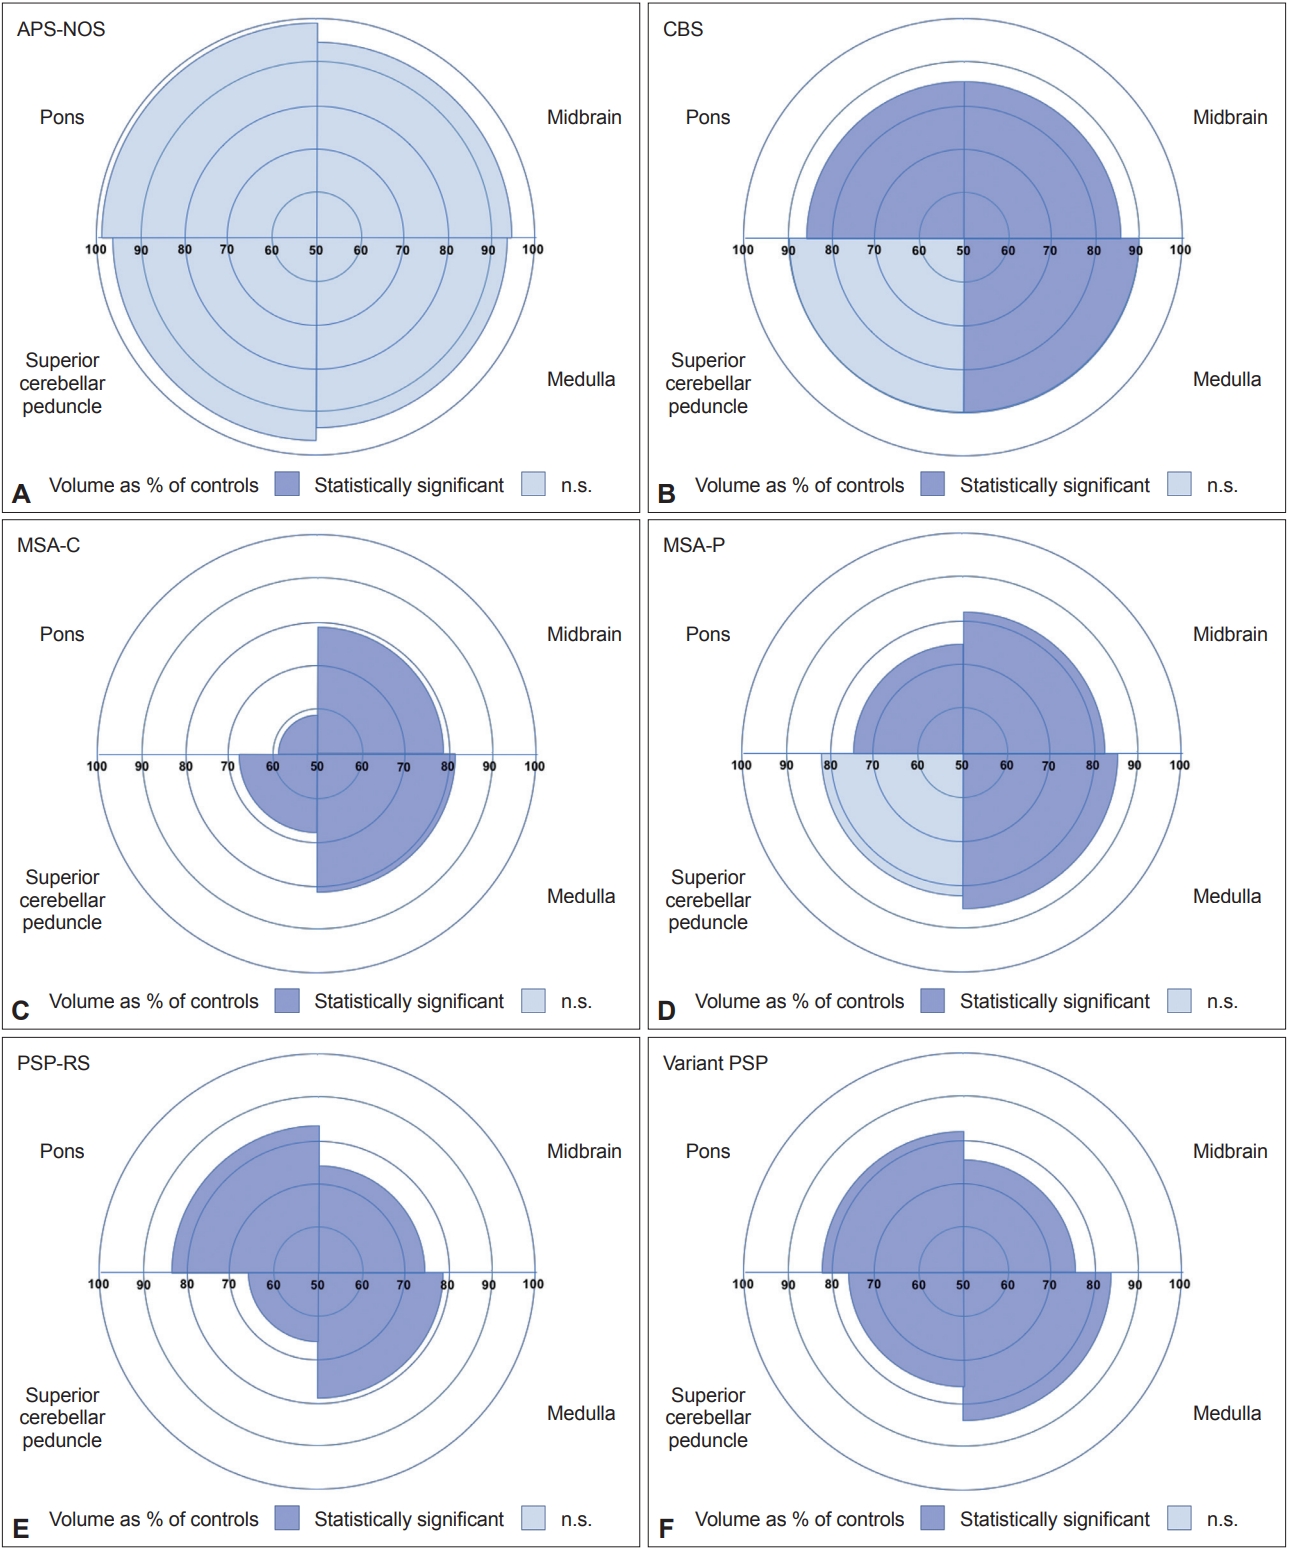
All brainstem regions were smaller in the MSA-C group (19–42% volume difference,
p < 0.0005) and in both PSP groups (18– 33%,
p < 0.0005) than in the control group (
Table 1 and
2,
Figure 2). The MSA-P group showed lower volumes in all regions except the SCP (15–26%,
p < 0.0005). The most affected region in the MSA-C and MSA-P groups was the pons (42% and 26%, respectively), while the most affected regions in both the PSPRS and variant PSP groups were the SCP (33% and 23%, respectively) and midbrain (26% and 24%, respectively). The brainstem was less affected in the CBS group, but nonetheless, the pons (14%,
p < 0.0005), midbrain (14%,
p < 0.0005) and medulla (10%,
p = 0.001) were significantly smaller in the CBS group than in the control group. The APS-NOS group did not show any significant differences from the control group.
When comparing the volumes between the clinical groups, the pons was smaller in the MSA-C group than in all the other groups (41% vs. the APS-NOS group; 33–42% vs. the CBS and both PSP groups; 25% vs. the MSA-P group). The MSA-P group showed a smaller pons than APS-NOS group (25%,
p < 0.0005). Both the PSP-RS and variant PSP groups showed a smaller midbrain than the APS-NOS group (18–21%,
p < 0.0005), and in the PSP-RS group, the midbrain and SCP were smaller than those in the CBS group (14% and 25%,
p < 0.002). In the PSP-RS and variant PSP groups, the pons was smaller than that in the APSNOS group (17%,
p < 0.002), and in the PSP-RS group, the SCP and medulla were smaller than those in the APS-NOS group (30% and 15%, respectively,
p < 0.001), while the MSA-C group showed a smaller SCP than the CBS and APS-NOS groups (26– 31%,
p < 0.002) and a smaller midbrain than the APS-NOS group (15%,
p = 0.001) (
Table 1 and
2).
We also performed a subanalysis comparing the individual variant PSP syndromes with the control group. Although the numbers are small in these groups, nonetheless, the midbrain was significantly smaller in almost all variant groups (except for the PSP-PGF group) than in the control group (22–27%,
p < 0.0005). Other significant differences in the brainstem measures were found in the PSP-P and PSP-CBS groups, where a significantly smaller pons was found than in the control group (22–24%,
p = 0.002), together with a smaller medulla in the PSP-CBS group than in the control group (24%,
p < 0.0005) (
Supplementary Table 1 in the online-only Data Supplement).
The brainstem volumes provided a high level of accuracy in their ability to discriminate between patients and controls, especially for the midbrain in the PSP-RS and variant PSP groups (100% and 98% accuracy, respectively,
p < 0.0005), and the midbrain and pons in the MSA-C and MSA-P groups (98%,
p < 0.0005) (
Table 3). When comparing the disease groups, the best discriminators were the pons volume for the comparisons of the MSA-C vs. the APS-NOS group (96% accuracy,
p = 0.003), the MSA-C vs. the CBS group (93%,
p = 0.001), and the MSA-C vs. the PSP-RS and variant PSP groups (90%,
p < 0.003) and the midbrain and medulla volumes for the PSP-RS and APS-NOS groups (92% and 89%, respectively,
p < 0.005) (
Table 3).
DISCUSSION
We have shown that with an automated segmentation method, we are able to accurately quantify the involvement of brainstem structures in atypical parkinsonian syndromes. We found that in MSA, the disease affects the pons most significantly, with this region being significantly smaller in the MSA-C group than in all other groups. This finding is in line with previous studies [
9-
11] and the clinically recognized “hot cross bun” sign typically described in MSA, which represents the degeneration of the pons and the pontocerebellar fibers [
12]. Abnormalities in other regions of the brainstem have been described in MSA to a lesser extent, which is also consistent with our findings here [
13-
15].
We found smaller volumes of the midbrain and the SCP in the PSP group. As other studies have shown, PSP is typically characterized by the “hummingbird” sign [
5,
12,
13], indicating atrophy in the midbrain (with relative preservation of the pons), together with atrophy in the SCP [
14,
15]. Here, we show that the same overall pattern of brainstem involvement occurs in those with variant PSP (SCP/midbrain > pons/medulla), as is seen with PSP-RS, but to a lesser extent.
Compared to the MSA and PSP groups, and as previously reported, the brainstem was less affected in the CBS group. CBS is typically characterized by asymmetric atrophy of the frontal and parietal cortex, together with the striatum [
12], but nonetheless, involvement of the midbrain, pons and medulla can also occur, as we have shown here [
9,
16].
Interestingly, none of the regions in the brainstem were affected in the APS-NOS group. This finding is suggestive that patients are at an earlier stage of the illness when the characteristic features for a specific diagnosis (both clinical and imaging) are not present; that these patients do not have MSA, PSP or CBS and instead have another form of parkinsonism, such as Lewy body disease; or potentially that APS-NOS is a mixture of different disorders at various stages in the disease process.
No prior investigations of automated regional brainstem segmentation in atypical parkinsonian syndromes have reported a similar breadth of brainstem structures in all of the disorders and variants. Two previous studies showed similar patterns of change in MSA-C and MSA-P vs. PSP-RS [
15] and in MSA (all variants) vs. PSP (all variants) [
17], although differences between patients and controls were on average smaller. This is likely to be due to differences either in disease stage (with their groups at an earlier timepoint) or in methodology [e.g., due to either the different MRI scanners used (1.5T in their studies vs. 3T here) or the segmentation technique itself].
With this automated method, we were able to simultaneously extract four different volumes of structures in the brainstem and quantify specific and differential features in atypical parkinsonian syndromes. Automated tools will be important in future trials with large patient numbers where manual segmentation is unfeasible. As we adapted the original FreeSurfer pipeline with GIF, we can consistently measure with the same pipeline not only these four regions in the brainstem but also 160 other brain regions segmented using GIF. Although this study already shows the usefulness of brainstem volumes alone in accurately distinguishing among these syndromes, future studies will be able to test whether combinations of regions of interest improve the discrimination of different atypical parkinsonian syndromes.
The limitations of this study include the lack of pathological data and the small number of patients with variant PSP; it would be useful to expand the sample and investigate the differences between the individual variants and PSP-RS. Moreover, the disease duration on average was 4.5 years; further studies are needed to clarify whether automated segmentation can discriminate diagnoses at an earlier stage. Future longitudinal studies that investigate the rate of atrophy in these brainstem regions will also be extremely important, allowing computation of sample sizes and helping with the design of clinical trials.
Supplementary Materials
Supplementary Table 1
Statistical comparisons of the brainstem volumetric measures between variant PSP and controls
jmd-19030-suppl.pdf
Notes
-
Conflicts of Interest
JDR has been on a medical advisory board for Wave Life Sciences and Ionis Pharmaceuticals. HRM has received grants from Parkinson’s UK, the Welsh Assembly Government, the Ipsen Fund, the Motor Neuron Disease (MND) Association, CBD Solutions, the Drake Foundation, and the Cure Parkinson’s Trust; personal fees from Teva, AbbVie, UCB Pharma, Boehringer Ingelheim, GSK, and GE Healthcare; and nonfinancial support from Teva, Medtronic, and Acorda. HRM is a consultant for AlzProtect, Acorda, BristolMyers-Squibb, E-scape, and the Wellcome Trust. In addition, HRM has a patent and is a coapplicant on a patent application related to C9ORF72–Method for diagnosing a neurodegenerative disease (PCT/GB2012/052140)–that is pending. All other authors report no disclosures.
Acknowledgments
The Dementia Research Centre is supported by Alzheimer’s Research UK, the Brain Research Trust, and the Wolfson Foundation. This work was supported by the National Institute for Health Research (NIHR) Queen Square Dementia Biomedical Research Unit and the NIHR UCL/H Biomedical Research Centre, the MRC UK GENFI grant (MR/M023664/1) and the Alzheimer’s Society (AS-PG-16-007). The PROSPECT study is supported by the Progressive Supranuclear Palsy (PSP) Association and the MSA Trust. JDR is supported by an MRC Clinician Scientist Fellowship (MR/M008525/1) and has received funding from the NIHR Rare Disease Translational Research Collaboration (BRC149/NS/MH). JDW received grant support from the Alzheimer’s Society and the NIHR UCL/UCLH Biomedical Research Centre. JEI is supported by the European Research Council (Starting Grant 677697, project BUNGEE-TOOLS). DLT is supported by the UCL Leonard Wolfson Experimental Neurology Centre (PR/ylr/18575). EJ is supported by the MRC (MR/S000992/1).
Figure 1.Example of brainstem segmentation mapped to the T1-weighted ICBM152 2009c Nonlinear Symmetric 1 × 1 × 1 mm template (McConnell Brain Imaging Centre, Montreal Neurological Institute, McGill University, Montreal, Quebec, Canada).
Figure 2.Volumes of the superior cerebellar peduncle, midbrain, pons, and medulla as a percentage of controls in (A) atypical parkinsonian syndrome not otherwise specified (APS-NOS), (B) corticobasal syndrome (CBS), (C) multiple system atrophy with cerebellar syndrome (MSA-C), (D) multiple system atrophy with parkinsonian syndrome (MSA-P), (E) progressive supranuclear palsy with a Richardson’s syndrome (PSP-RS) and (F) variant PSP. Colors denote whether the differences were statistically significant. n.s.: not significant.
Table 1.Demographic, clinical and volumetric measures of the brainstem in patients and controls
Groups |
n
|
Age (years) |
Gender (male) [n (%)] |
Disease duration (years) |
Medulla |
Pons |
SCP |
Midbrain |
Whole brainstem |
Control |
42 |
65.3 (7.4) |
18 (43) |
- |
0.37 (0.03) |
1.06 (0.09) |
0.02 (0.00) |
0.44 (0.03) |
1.88 (0.14) |
APS-NOS |
7 |
72.5 (8.9) |
3 (43) |
4.4 (1.8) |
0.34 (0.02) |
1.04 (0.16) |
0.02 (0.00) |
0.42 (0.06) |
1.81 (0.23) |
CBS |
14 |
64.3 (8.2) |
7 (50) |
5.0 (2.7) |
0.33 (0.03) |
0.91 (0.11) |
0.01 (0.00) |
0.38 (0.05) |
1.64 (0.19) |
MSA |
|
|
|
|
|
|
|
|
|
MSA-C |
8 |
62.3 (8.1) |
6 (75) |
4.3 (2.9) |
0.30 (0.03) |
0.61 (0.17) |
0.01 (0.00) |
0.35 (0.04) |
1.27 (0.23) |
MSA-P |
8 |
59.0 (10.8) |
6 (75) |
4.2 (1.5) |
0.31 (0.03) |
0.78 (0.16) |
0.01 (0.00) |
0.36 (0.02) |
1.47 (0.19) |
PSP-RS |
12 |
64.6 (7.8) |
10 (83) |
2.7 (1.1) |
0.29 (0.04) |
0.86 (0.08) |
0.01 (0.00) |
0.33 (0.03) |
1.50 (0.14) |
Variant PSP |
18 |
74.7 (5.5) |
10 (56) |
5.7 (2.1) |
0.30 (0.04) |
0.86 (0.13) |
0.01 (0.00) |
0.34 (0.05) |
1.51 (0.22) |
Subtypes of variant PSP |
|
|
|
|
|
|
|
|
|
PSP-CBS |
7 |
77.6 (2.9) |
3 (43) |
5.1 (1.8) |
0.28 (0.04) |
0.82 (0.13) |
0.01 (0.00) |
0.33 (0.05) |
1.44 (0.22) |
PSP-PGF |
2 |
69.6 (5.4) |
2 (100) |
5.6 (1.1) |
0.34 (0.01) |
1.05 (0.06) |
0.02 (0.00) |
0.41 (0.01) |
1.81 (0.06) |
PSP-P |
3 |
74.8 (12.4) |
2 (67) |
5.5 (2.9) |
0.31 (0.04) |
0.80 (0.11) |
0.01 (0.00) |
0.32 (0.06) |
1.45 (0.22) |
PSP-F |
3 |
74.6 (1.7) |
2 (67) |
5.2 (2.2) |
0.31 (0.01) |
0.90 (0.09) |
0.01 (0.00) |
0.34 (0.04) |
1.57 (0.14) |
PSP-SL |
3 |
72.8 (0.6) |
1 (33) |
7.8 (2.6) |
0.31 (0.04) |
0.83 (0.14) |
0.01 (0.00) |
0.33 (0.06) |
1.48 (0.24) |
Table 2.Statistical comparisons of the brainstem volumetric measures between patients and controls
Group comparisons |
|
Medulla |
Pons |
SCP |
Midbrain |
Whole brainstem |
Controls |
|
|
|
|
|
|
APS-NOS |
p
|
0.189 |
0.903 |
0.767 |
0.19 |
0.546 |
|
% |
7 |
2 |
4 |
6 |
4 |
CBS |
p
|
0.001*
|
< 0.0005*
|
0.08 |
< 0.0005*
|
< 0.0005*
|
|
% |
10*
|
14*
|
10 |
14*
|
13*
|
MSA-C |
p
|
< 0.0005*
|
< 0.0005*
|
< 0.0005*
|
< 0.0005*
|
< 0.0005*
|
|
% |
19*
|
42*
|
33*
|
21*
|
32*
|
MSA-P |
p
|
< 0.0005*
|
< 0.0005*
|
0.018 |
< 0.0005*
|
< 0.0005*
|
|
% |
15*
|
26*
|
18 |
18*
|
22*
|
PSP-RS |
p
|
< 0.0005*
|
< 0.0005*
|
< 0.0005*
|
< 0.0005*
|
< 0.0005*
|
|
% |
21*
|
18*
|
33*
|
26*
|
21*
|
Variant PSP |
p
|
< 0.0005*
|
< 0.0005*
|
< 0.0005*
|
< 0.0005*
|
< 0.0005*
|
|
% |
18*
|
19*
|
23*
|
24*
|
20*
|
APS-NOS |
|
|
|
|
|
|
CBS |
p
|
0.281 |
0.016 |
0.38 |
0.027 |
0.022 |
|
% |
3 |
12 |
6 |
8 |
9 |
MSA-C |
p
|
0.006 |
< 0.0005*
|
0.001*
|
0.001*
|
< 0.0005*
|
|
% |
13 |
41*
|
31*
|
15*
|
30*
|
MSA-P |
p
|
0.058 |
< 0.0005*
|
0.098 |
0.005 |
< 0.0005*
|
|
% |
9 |
25*
|
15 |
13 |
19*
|
PSP-RS |
p
|
0.001*
|
0.002*
|
< 0.0005*
|
< 0.0005*
|
< 0.0005*
|
|
% |
15*
|
17*
|
30*
|
21*
|
17*
|
Variant PSP |
p
|
0.011 |
0.001*
|
0.018 |
< 0.0005*
|
< 0.0005*
|
|
% |
12 |
17*
|
20 |
18*
|
17*
|
CBS |
|
|
|
|
|
|
MSA-C |
p
|
0.025 |
< 0.0005*
|
0.002*
|
0.053 |
< 0.0005*
|
|
% |
10 |
33*
|
26*
|
8 |
22*
|
MSA-P |
p
|
0.223 |
0.014 |
0.348 |
0.221 |
0.033 |
|
% |
6 |
14 |
9 |
5 |
10 |
PSP-RS |
p
|
0.006 |
0.314 |
0.001*
|
0.002*
|
0.058 |
|
% |
13 |
5 |
25*
|
14*
|
9 |
Variant PSP |
p
|
0.101 |
0.436 |
0.096 |
0.023 |
0.184 |
|
% |
9 |
6 |
14 |
12 |
8 |
MSA-C |
|
|
|
|
|
|
MSA-P |
p
|
0.367 |
0.004*
|
0.060 |
0.538 |
0.026 |
|
% |
-5 |
-28*
|
-23 |
-3 |
-16 |
PSP-RS |
p
|
0.677 |
< 0.0005*
|
0.822 |
0.253 |
0.005 |
|
% |
3 |
-42*
|
-1 |
6 |
-18 |
Variant PSP |
p
|
0.449 |
< 0.0005*
|
0.067 |
0.855 |
0.001*
|
|
% |
-1 |
-41*
|
-16 |
4 |
-19*
|
MSA-P |
|
|
|
|
|
|
PSP-RS |
p
|
0.167 |
0.115 |
0.069 |
0.076 |
0.711 |
|
% |
7 |
-11 |
18 |
9 |
-2 |
Variant PSP |
p
|
0.818 |
0.091 |
0.812 |
0.410 |
0.371 |
|
% |
4 |
-10 |
6 |
7 |
-3 |
PSP-RS |
|
|
|
|
|
|
Variant PSP |
p
|
0.182 |
0.767 |
0.04 |
0.298 |
0.487 |
|
% |
-4 |
1 |
-15 |
-3 |
-1 |
Table 3.Diagnostic accuracy between the disease groups and the controls for the brainstem volumetric measures
|
APS-NOS
|
CBS
|
MSA-C
|
MSA-P
|
PSP-RS
|
Variant PSP
|
AUC (95% CI) |
p value |
AUC (95% CI) |
p value |
AUC (95% CI) |
p value |
AUC (95% CI) |
p value |
AUC (95% CI) |
p value |
AUC (95% CI) |
p value |
Controls |
|
|
|
|
|
|
|
|
|
|
|
|
Medulla |
0.728 (0.552–0.904) |
0.056 |
0.767 (0.626–0.908)*
|
0.003*
|
0.926 (0.831–1.000)*
|
< 0.0005*
|
0.914 (0.827–1.000)*
|
< 0.0005*
|
0.952 (0.893–1.000)*
|
< 0.0005*
|
0.911 (0.840–0.982)*
|
< 0.0005*
|
Pons |
0.602 (0.306–0.898) |
0.391 |
0.847 (0.722–0.972)*
|
< 0.0005*
|
0.982 (0.945–1.000)*
|
< 0.0005*
|
0.979 (0.941–1.000)*
|
< 0.0005*
|
0.952 (0.895–1.000)*
|
< 0.0005*
|
0.892 (0.795–0.988)*
|
< 0.0005*
|
SCP |
0.527 (0.269–0.785) |
0.819 |
0.602 (0.406–0.798) |
0.256 |
0.946 (0.886–1.000)*
|
< 0.0005*
|
0.747 (0.556–0.938) |
0.028 |
0.940 (0.879–1.000)*
|
< 0.0005*
|
0.817 (0.683–0.952)*
|
< 0.0005*
|
Midbrain |
0.707 (0.441–0.974) |
0.081 |
0.862 (0.750–0.975)*
|
< 0.0005*
|
0.973 (0.920–1.000)*
|
< 0.0005*
|
0.988 (0.962–1.000)*
|
< 0.0005*
|
1.000 (1.000–1.000)*
|
< 0.0005*
|
0.983 (0.959–1.000)*
|
< 0.0005*
|
Whole brainstem |
0.653 (0.375–0.931) |
0.199 |
0.840 (0.714–0.966)*
|
< 0.0005*
|
0.988 (0.962–1.000)*
|
< 0.0005*
|
0.985 (0.953–1.000)*
|
< 0.0005*
|
0.976 (0.939–1.000)*
|
< 0.0005*
|
0.938 (0.878–0.998)*
|
< 0.0005*
|
APS-NOS |
- |
|
|
|
|
|
|
|
|
|
|
|
Medulla |
|
|
0.561 (0.314–0.808) |
0.654 |
0.836 (0.631–1.000) |
0.028 |
0.821 (0.604–1.000) |
0.037 |
0.893 (0.747–1.000) |
0.005 |
0.786 (0.590–0.981) |
0.029 |
Pons |
|
|
0.745 (0.530–0.959) |
0.073 |
0.964 (0.877–1000)*
|
0.003*
|
0.911 (0.763–1.000) |
0.008 |
0.845 (0.669–1.000) |
0.014 |
0.825 (0.661–0.990) |
0.013 |
SCP |
|
|
0.561 (0.298–0.824) |
0.654 |
0.893 (0.690–0.1000) |
0.011 |
0.732 (0.454–1.000) |
0.132 |
0.881 (0.696–1.000) |
0.007 |
0.762 (0.536–0.988) |
0.046 |
Midbrain |
|
|
0.602 (0.321–0.883) |
0.456 |
0.839 (0.616–0.1000) |
0.028 |
0.804 (0.535–1.000) |
0.049 |
0.917 (0.756–1.000)*
|
0.003*
|
0.825 (0.654–0.997) |
0.013 |
Whole brainstem |
|
|
0.714 (0.489–0.940) |
0.117 |
0.946 (0.830–1.000)*
|
0.004*
|
0.893 (0.725–1.000) |
0.011 |
0.917 (0.792–1.000)*
|
0.003*
|
0.825 (0.661–0.990) |
0.013 |
CBS |
- |
|
- |
|
|
|
|
|
|
|
|
|
Medulla |
|
|
|
|
0.759 (0.543–0.975) |
0.048 |
0.679 (0.452–0.905) |
0.172 |
0.792 (0.615–0.968) |
0.012 |
0.706 (0.522–0.891) |
0.048 |
Pons |
|
|
|
|
0.929 (0.790–1.000)*
|
0.001*
|
0.732 (0.515–0.949) |
0.076 |
0.625 (0.407–0.843) |
0.280 |
0.619 (0.423–0.815) |
0.254 |
SCP |
|
|
|
|
0.795 (0.603–0.987) |
0.024 |
0.616 (0.381–0.851) |
0.375 |
0.804 (0.627–0.980) |
0.009 |
0.667 (0.465–0.868) |
0.111 |
Midbrain |
|
|
|
|
0.679 (0.449–0.908) |
0.172 |
0.616 (0.376–0.853) |
0.375 |
0.780 (0.601–0.959) |
0.016 |
0.762 (0.596–0.928) |
0.012 |
Whole brainstem |
|
|
|
|
0.911 (0.768–1.000)*
|
0.002*
|
0.714 (0.497–0.932) |
0.101 |
0.708 (0.508–0.909) |
0.072 |
0.671 (0.483–0.858) |
0.102 |
MSA-C |
- |
|
- |
|
- |
|
|
|
|
|
|
|
Medulla |
|
|
|
|
|
|
0.625 (0.337–0.913) |
0.401 |
0.573 (0.312–0.834) |
0.589 |
0.528 (0.286–0.770) |
0.824 |
Pons |
|
|
|
|
|
|
0.750 (0.488–1.000) |
0.093 |
0.896 (0.701–1.000)*
|
0.003*
|
0.896 (0.726–1.000)*
|
0.002*
|
SCP |
|
|
|
|
|
|
0.750 (0.491–1.000) |
0.093 |
0.521 (0.256–0.786) |
0.877 |
0.646 (0.416–0.873) |
0.243 |
Midbrain |
|
|
|
|
|
|
0.625 (0.337–0.913) |
0.401 |
0.667 (0.413–0.920) |
0.217 |
0.583 (0.360–0.807) |
0.505 |
Whole brainstem |
|
|
|
|
|
|
0.766 (0.514–1.000) |
0.074 |
0.823 (0.603–1.000) |
0.017 |
0.813 (0.623–1.000) |
0.012 |
MSA-P |
- |
|
- |
|
- |
|
- |
|
|
|
|
|
Medulla |
|
|
|
|
|
|
|
|
0.663 (0.449–0.876) |
0.186 |
0.549 (0.317–0.780) |
0.697 |
Pons |
|
|
|
|
|
|
|
|
0.531 (0.294–0.769) |
0.799 |
0.583 (0.339–0.827) |
0.505 |
SCP |
|
|
|
|
|
|
|
|
0.738 (0.507–0.968) |
0.053 |
0.569 (0.313–0.826) |
0.579 |
Midbrain |
|
|
|
|
|
|
|
|
0.744 (0.559–0.929) |
0.047 |
0.653 (0.445–0.861) |
0.222 |
Whole brainstem |
|
|
|
|
|
|
|
|
0.606 (0.370–0.842) |
0.387 |
0.528 (0.291–0.765) |
0.824 |
PSP-RS |
- |
|
- |
|
- |
|
- |
|
- |
|
|
|
Medulla |
|
|
|
|
|
|
|
|
|
|
0.597 (0.388–0.806) |
0.374 |
Pons |
|
|
|
|
|
|
|
|
|
|
0.537 (0.329–0.745) |
0.735 |
SCP |
|
|
|
|
|
|
|
|
|
|
0.639 (0.432–0.846) |
0.204 |
Midbrain |
|
|
|
|
|
|
|
|
|
|
0.528 (0.318–0.737) |
0.799 |
Whole brainstem |
|
|
|
|
|
|
|
|
|
|
0.537 (0.328–0.746) |
0.735 |
REFERENCES
- 1. Höglinger GU, Respondek G, Stamelou M, Kurz C, Josephs KA, Lang AE, et al. Clinical diagnosis of progressive supranuclear palsy: the movement disorder society criteria. Mov Disord 2017;32:853–864.ArticlePubMedPMC
- 2. Armstrong MJ, Litvan I, Lang AE, Bak TH, Bhatia KP, Borroni B, et al. Criteria for the diagnosis of corticobasal degeneration. Neurology 2013;80:496–503.ArticlePubMedPMC
- 3. Gilman S, Wenning GK, Low PA, Brooks DJ, Mathias CJ, Trojanowski JQ, et al. Second consensus statement on the diagnosis of multiple system atrophy. Neurology 2008;71:670–676.ArticlePubMedPMC
- 4. McFarland NR. Diagnostic approach to atypical Parkinsonian syndromes. Continuum (Minneap Minn) 2016;22(4 Movement Disorders):1117–1142.ArticlePubMedPMC
- 5. Whitwell JL, Höglinger GU, Antonini A, Bordelon Y, Boxer AL, Colosimo C, et al. Radiological biomarkers for diagnosis in PSP: where are we and where do we need to be? Mov Disord 2017;32:955–971.ArticlePubMedPMC
- 6. Cardoso MJ, Modat M, Wolz R, Melbourne A, Cash D, Rueckert D, et al. Geodesic information flows: spatially-variant graphs and their application to segmentation and fusion. IEEE Trans Med Imaging 2015;34:1976–1988.ArticlePubMed
- 7. Iglesias JE, Van Leemput K, Bhatt P, Casillas C, Dutt S, Schuff N, et al. Bayesian segmentation of brainstem structures in MRI. Neuroimage 2015;113:184–195.ArticlePubMedPMC
- 8. Malone IB, Leung KK, Clegg S, Barnes J, Whitwell JL, Ashburner J, et al. Accurate automatic estimation of total intracranial volume: a nuisance variable with less nuisance. Neuroimage 2015;104:366–372.ArticlePubMedPMC
- 9. Massey LA, Micallef C, Paviour DC, O’Sullivan SS, Ling H, Williams DR, et al. Conventional magnetic resonance imaging in confirmed progressive supranuclear palsy and multiple system atrophy. Mov Disord 2012;27:1754–1762.ArticlePubMed
- 10. Reginold W, Lang AE, Marras C, Heyn C, Alharbi M, Mikulis DJ. Longitudinal quantitative MRI in multiple system atrophy and progressive supranuclear palsy. Parkinsonism Relat Disord 2014;20:222–225.ArticlePubMed
- 11. Bhattacharya K, Saadia D, Eisenkraft B, Yahr M, Olanow W, Drayer B, et al. Brain magnetic resonance imaging in multiple-system atrophy and Parkinson disease: a diagnostic algorithm. Arch Neurol 2002;59:835–842.ArticlePubMed
- 12. Saeed U, Compagnone J, Aviv RI, Strafella AP, Black SE, Lang AE, et al. Imaging biomarkers in Parkinson’s disease and Parkinsonian syndromes: current and emerging concepts. Transl Neurodegener 2017;6:8.ArticlePubMedPMCPDF
- 13. Heim B, Krismer F, De Marzi R, Seppi K. Magnetic resonance imaging for the diagnosis of Parkinson’s disease. J Neural Transm (Vienna) 2017;124:915–964.ArticlePubMedPMCPDF
- 14. Kassubek J. MRI-based neuroimaging: atypical parkinsonisms and other movement disorders. Curr Opin Neurol 2018;31:425–430.ArticlePubMed
- 15. Huppertz HJ, Möller L, Südmeyer M, Hilker R, Hattingen E, Egger K, et al. Differentiation of neurodegenerative parkinsonian syndromes by volumetric magnetic resonance imaging analysis and support vector machine classification. Mov Disord 2016;31:1506–1517.ArticlePubMed
- 16. Lee SE, Rabinovici GD, Mayo MC, Wilson SM, Seeley WW, DeArmond SJ, et al. Clinicopathological correlations in corticobasal degeneration. Ann Neurol 2011;70:327–340.ArticlePubMedPMC
- 17. Scherfler C, Göbel G, Müller C, Nocker M, Wenning GK, Schocke M, et al. Diagnostic potential of automated subcortical volume segmentation in atypical parkinsonism. Neurology 2016;86:1242–1249.ArticlePubMed
Citations
Citations to this article as recorded by
- A Parkinson’s disease-related nuclei segmentation network based on CNN-Transformer interleaved encoder with feature fusion
Hongyi Chen, Junyan Fu, Xiao Liu, Zhiji Zheng, Xiao Luo, Kun Zhou, Zhijian Xu, Daoying Geng
Computerized Medical Imaging and Graphics.2024; 118: 102465. CrossRef - Loss of brainstem white matter predicts onset and motor neuron symptoms in C9orf72 expansion carriers: a GENFI study
Agnès Pérez-Millan, Sergi Borrego-Écija, John C. van Swieten, Lize Jiskoot, Fermin Moreno, Robert Laforce, Caroline Graff, Mario Masellis, Maria Carmela Tartaglia, James B. Rowe, Barbara Borroni, Elizabeth Finger, Matthis Synofzik, Daniela Galimberti, Rik
Journal of Neurology.2023; 270(3): 1573. CrossRef - Comparative validation of AI and non-AI methods in MRI volumetry to diagnose Parkinsonian syndromes
Joomee Song, Juyoung Hahm, Jisoo Lee, Chae Yeon Lim, Myung Jin Chung, Jinyoung Youn, Jin Whan Cho, Jong Hyeon Ahn, Kyungsu Kim
Scientific Reports.2023;[Epub] CrossRef - Identification of the pathogenesis features of various phenotypes of multiple sclerosis based on the study of the morphological functional connectivity of subcortical gray matter structures
A. G. Trufanov, A. Y. Polushin, E. A. Gorbunova, M. V. Lukin
Russian Journal for Personalized Medicine.2023; 3(1): 27. CrossRef - Structural MRI predicts clinical progression in presymptomatic genetic frontotemporal dementia: findings from the GENetic Frontotemporal dementia Initiative cohort
Martina Bocchetta, Emily G Todd, Arabella Bouzigues, David M Cash, Jennifer M Nicholas, Rhian S Convery, Lucy L Russell, David L Thomas, Ian B Malone, Juan Eugenio Iglesias, John C van Swieten, Lize C Jiskoot, Harro Seelaar, Barbara Borroni, Daniela Galim
Brain Communications.2023;[Epub] CrossRef - Quantitative MRI protocol and decision model for a ‘one stop shop’ early-stage Parkinsonism diagnosis: Study design
Samy Abo Seada, Anke W. van der Eerden, Agnita J.W. Boon, Juan A. Hernandez-Tamames
NeuroImage: Clinical.2023; 39: 103506. CrossRef - Neuroimaging correlates of brain injury in Wilson’s disease: a multimodal, whole-brain MRI study
Samuel Shribman, Martina Bocchetta, Carole H Sudre, Julio Acosta-Cabronero, Maggie Burrows, Paul Cook, David L Thomas, Godfrey T Gillett, Emmanuel A Tsochatzis, Oliver Bandmann, Jonathan D Rohrer, Thomas T Warner
Brain.2022; 145(1): 263. CrossRef - Nuclear imaging in Parkinson's disease: The past, the present, and the future
Haim Golan, Olga Volkov, Eli Shalom
Journal of the Neurological Sciences.2022; 436: 120220. CrossRef - Criteria-unfulfilled multiple system atrophy at an initial stage exhibits laterality of middle cerebellar peduncles
Minori Furuta, Masayuki Sato, Setsuki Tsukagoshi, Yoshito Tsushima, Yoshio Ikeda
Journal of the Neurological Sciences.2022; 438: 120281. CrossRef - A data-driven model of brain volume changes in progressive supranuclear palsy
W. J. Scotton, M. Bocchetta, E. Todd, D. M. Cash, N. Oxtoby, L. VandeVrede, H. Heuer, D. C. Alexander, J. B. Rowe, H. R. Morris, A. Boxer, J. D. Rohrer, P. A. Wijeratne
Brain Communications.2022;[Epub] CrossRef - Neuroimaging Correlates of Cognitive Deficits in Wilson's Disease
Samuel Shribman, Maggie Burrows, Rhian Convery, Martina Bocchetta, Carole H. Sudre, Julio Acosta‐Cabronero, David L. Thomas, Godfrey T. Gillett, Emmanuel A. Tsochatzis, Oliver Bandmann, Jonathan D. Rohrer, Thomas T. Warner
Movement Disorders.2022; 37(8): 1728. CrossRef - Corticobasal syndrome and Parkinson’s disease at the beginning: asymmetrical patterns of MRI and Blink Reflex for early diagnosis
Giulia Donzuso, Giorgia Sciacca, Antonina Luca, Calogero E. Cicero, Giovanni Mostile, Alessandra Nicoletti, Mario Zappia
Journal of Neural Transmission.2022; 129(12): 1427. CrossRef - Eye movements and association with regional brain atrophy in clinical subtypes of progressive supranuclear palsy
Ji-Hyun Choi, Heejung Kim, Jung Hwan Shin, Jee-Young Lee, Han-Joon Kim, Jong-Min Kim, Beomseok Jeon
Journal of Neurology.2021; 268(3): 967. CrossRef - Artificial intelligence applied to neuroimaging data in Parkinsonian syndromes: Actuality and expectations
Annalisa Vitale, Rossella Villa, Lorenzo Ugga, Valeria Romeo, Arnaldo Stanzione, Renato Cuocolo
Mathematical Biosciences and Engineering.2021; 18(2): 1753. CrossRef - Differential early subcortical involvement in genetic FTD within the GENFI cohort
Martina Bocchetta, Emily G. Todd, Georgia Peakman, David M. Cash, Rhian S. Convery, Lucy L. Russell, David L. Thomas, Juan Eugenio Iglesias, John C. van Swieten, Lize C. Jiskoot, Harro Seelaar, Barbara Borroni, Daniela Galimberti, Raquel Sanchez-Valle, Ro
NeuroImage: Clinical.2021; 30: 102646. CrossRef - Quantitative MRI markers in Parkinson's disease and parkinsonian syndromes
Germain Arribarat, Patrice Péran
Current Opinion in Neurology.2020; 33(2): 222. CrossRef