E-submission
Articles
- Page Path
- HOME > J Mov Disord > Volume 3(2); 2010 > Article
-
Case Report
Preserved Glucose Metabolism of Deep Cerebellar Nuclei in a Case of Multiple System Atrophy with Predominant Cerebellar Ataxia: F-18 Fluorodeoxyglucose Positron Emission Tomography Study - Oh Dae Kwona, Chang-Seok Kib
-
Journal of Movement Disorders 2010;3(2):51-53.
DOI: https://doi.org/10.14802/jmd.10014
Published online: October 30, 2010
aDepartment of Neurolgy, School of Medicine, Catholic University of Daegu, Daegu Catholic University Medical Center, Daegu, Korea
bDepartment of Laboratory Medicine, Samsung Medical Center, Sungkyunkwan University School of Medicine, Seoul, Korea
- Corresponding author: Oh Dae Kwon, MD, PhD, Department of Neurology, School of Medicine, Catholic University of Daegu, Daegu Catholic University Medical Center, 3056-6 Daemyeong 4-dong, Nam-gu, Daegu 705-718, Korea, Tel +82-53-650-4298, Fax +82-53-654-9786, E-mail dolbaeke@cu.ac.kr
• Received: August 31, 2010 • Accepted: October 19, 2010
Copyright © 2010 The Korean Movement Disorder Society
This is an Open Access article distributed under the terms of the Creative Commons Attribution Non-Commercial License (http://creativecommons.org/licenses/by-nc/3.0/) which permits unrestricted non-commercial use, distribution, and reproduction in any medium, provided the original work is properly cited.
- 19,855 Views
- 36 Download
ABSTRACT
- The cerebellar glucose metabolism of multiple system atrophy with predominant cerebellar ataxia (MSA-C) is known to be decreased but is not defined among areas of cerebellum. We encountered a 54-year-old man who developed dizziness and progressive ataxia followed by urinary incontinence and orthostatic hypotension, all of those symptoms progressed relentlessly and the symptoms responded poorly to levodopa therapy. Visual analysis and statistical parametric mapping analysis of F-18 fluorodeoxyglucose positron emission tomography showed hypometabolism of both cerebellar hemisphere, severe at cortical area, and pons. There was clear sparing of deep cerebellar nuclei. Our report, as we know, shows the first case of preserved glucose metabolism of deep cerebellar nuclei relative to cerebellar cortex in an MSA-C patient.
- The patient presented himself to us at the age of 54 yr with a history of intermittent attacks of dizziness and mild sense of disequilibrium lasting minutes to a whole day for years. He did not have previous history of ear trauma, otitis media and vertigo. The laboratory tests were included serum profiles of liver and kidney functions; complete blood counts; serum level of vitamin E, B12, and folic acid; and studies of thyroid function, which showed normal results. A search for occult malignancy and 5 years of follow revealed no evidence of malignancy. The first brain magnetic resonance imaging (MRI) and brain magnetic resonance angiography (MRA) showed no specific abnormality (Figure 1). The first neuropsychological tests showed normal cognitive function and evaluation for metabolic derangement were normal. Over the subsequent years, the episodic symptoms slowly progressed in the frequency, severity, and duration. And the symptoms responded poorly to levodopa therapy.
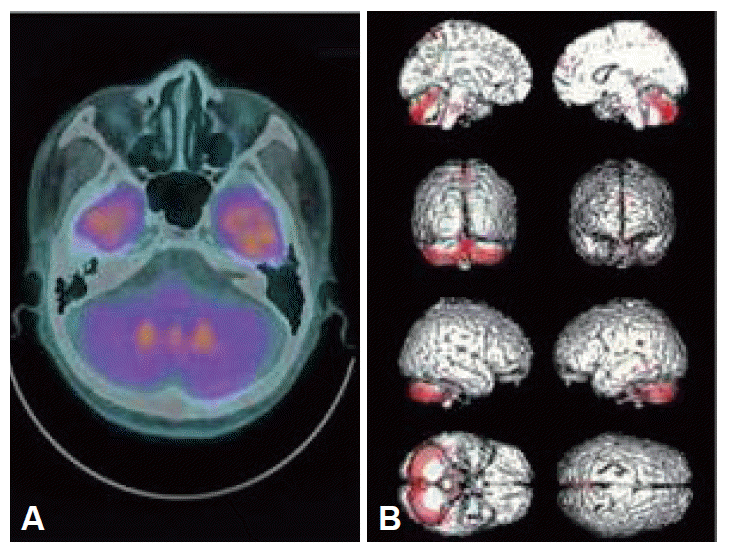
- When he visited our hospital again at the age of 56 yr he showed severe ataxic gait, intention tremor, dysarthria, as well as urinary incontinence and orthostatic hypotension. The neurologic examination showed scanning slurred speech, wide based ataxic gait, impaired tandem gait, swing both in eye-open and closure on the Romberg test. He also showed impaired finger to nose test and heel to shin test bilaterally. Follow up brain MRI showed cerebellar atrophy of moderate degree and mild frontal atrophy (Figure 1). Brain F-18-FDG PET performed at the same period and was analyzed by SPM2. There was diffusely decreased metabolism on both cerebellar hemisphere, prominence of cerebellar cortical area, vermis, cerebellar peduncle and middle pons, relatively sparing of deep cerebellar nuclei (Figure 2). Third brain MRI done at the age of 58 yr showed hot cross bun sign, indicating degeneration of transverse pontine fibers as well as bilateral putaminal atrophy.
- Extensive genetic tests for spinocerebellar ataxia type 1, 2, 3, 6, 7, 8 and point mutation of 47 exons of CACNA1A gene revealed no abnormalities. His son and daughter also showed normal genetic tests for spinocerebellar ataxias. There was no history of same syndrome in his family trees.
Case
- The patient shows typical symptoms of probable MSA-C. He also has glucose hypometabolism of cerebellum and pons as well as severe atrophy of these areas.
- The second MRI shows cerebellar atrophy but little brainstem atrophy or cortical atrophy. The hot cross bun sign and putaminal atrophy appeared apparently at 3rd MRI, indicating that it might not appear in the first several years with clinical symptoms.
- The cerebellar glucose metabolism of MSA-C is known to be usually decreased. However the features are not clearly elucidated.2 Juh et al. reported cerebellar hypometabolism of five MSA patients out of eleven by FDG-PET. All the five patients showed asymmetric irregular hypometabolic areas and four of them showed cerebellar cortical involvement. Visual analysis of the FDG-PET of our patient shows very clear discrimination of hypometabolic area of cerebellum.3 It is characteristic that deep cerebellar nuclei were relatively spared and the hypometabolic areas are quite symmetric (Figure 2). SPM analysis showed more precise anatomical differences of glucose metabolism. The cerebellar cortex, containing Purkinje cells, showed most prominent hypometabolic area and cerebellar white matter showed relatively lesser hypometabolism. Most of all, the deep cerebellar nuclei showed relatively spared of glucose metabolism. The reason why does the cerebellar cortex is vulnerable to the mechanism of the disease could be explained by glutamate excitotoxicity.4 Glutamate dehydrogenase, an enzyme central to glutamate metabolism, is significantly reduced in patients with heterogenous neurological disorders characterized by MSA and predominant involvement of the cerebellum and its connections.4 Moreover, there are relative deficiencies in aldolase C and excitatory amino acid transporter (EAAT4) that are localized extrasynaptically on Purkinje cell spines than other areas of brain.5 The enzymes work as glutamate transporters and play a critical role in the maintenance of low extracellular concentrations of glutamate. In case of global brain ischemia or other excitotoxic injuries, the relative deficiency of the enzymes is related to severe damage of Purkinje cells than other areas of cerebellum.6 Secondly, the deep cerebellar nuclei may have benefit of being proximity from brainstem and could have more blood supply for survival.7 Our report, as we know, shows the first case of preserved metabolism of deep cerebellar nuclei relative to cerebellar cortical area.
Discussion
Figure 1Brain MRIs of axial view on the level of cerebellar peduncle and mid-sagittal view. Normal in the initial evaluation (1st row) and the second MRI shows moderate cerebellar atrophy with mild brainstem atrophy (2nd row). Third brain MRI shows hot cross buns sign and putaminal atrophy on axial view and severe cerebellar atrophy and moderate atrophy of brainstem and cerebral cortex (3rd row).
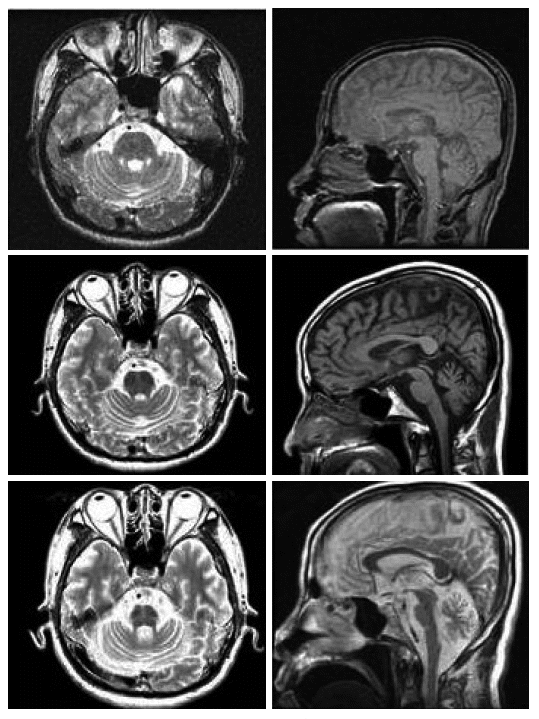
Figure 2Brain fluorodeoxyglucose positron emission tomography on the level of cerebellar peduncle (A) shows diffuse hypometabolism on both cerebellum, relatively sparing deep cerebellar nuclei. Statistical parametric mapping 2 analysis of hypometabolic area (B) shows that cerebellar cortex shows most decreased hypometabolic area in cerebellar cortex relatively sparing deep cerebellar nuclei.

- 1. Wenning GK, Tison F, Ben Shlomo Y, Daniel SE, Quinn NP. Multiple system atrophy: a review of 203 pathologically proven cases. Mov Disord 1997;12:133–147.ArticlePubMed
- 2. Gilman S, St Laurent RT, Koeppe RA, Junck L, Kluin KJ, Lohman M. A comparison of cerebral blood flow and glucose metabolism in olivo-pontocerebellar atrophy using PET. Neurology 1995;45:1345–1352.ArticlePubMed
- 3. Juh R, Pae CU, Lee CU, Yang D, Chung Y, Suh T, Choe B. Voxel based comparison of glucose metabolism in the differential diagnosis of the multiple system atrophy using statistical parametric mapping. Neurosci Res 2005;52:211–219.ArticlePubMed
- 4. Plaitakis A, Flessas P, Natsiou AB, Shashidharan P. Glutamate dehydrogenase deficiency in cerebellar degenerations: clinical, biochemical and molecular genetic aspects. Can J Neurol Sci 1993;20( Suppl 3):S109–S116.ArticlePubMed
- 5. Tanaka J, Ichikawa R, Watanabe M, Tanaka K, Inoue Y. Extra-junctional localization of glutamate transporter EAAT4 at excitatory Purkinje cell synapses. Neuroreport 1997;8:2461–2464.ArticlePubMed
- 6. Welsh JP, Yuen G, Placantonakis DG, Vu TQ, Haiss F, O’Hearn E, et al. Why do Purkinje cells die so easily after global brain ischemia? Aldolase C, EAAT4, and the cerebellar contribution to posthypoxic myoclonus. Adv Neurol 2002;89:331–359.PubMed
- 7. Duus P. Topical diagnosis in neurology. 3rd revised ed. New York: Thieme; 1998:137–174.
REFERENCES
Figure & Data
References
Citations
Citations to this article as recorded by 
Comments on this article
 PubReader
 ePub Link
 Cite
Cite