Microglial Imaging in Movement Disorders With PK11195 PET
Article information
Abstract
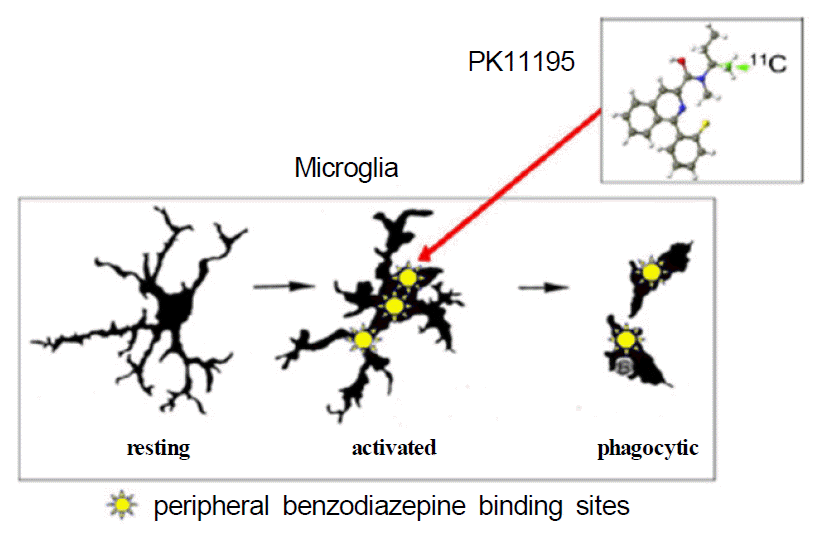
Activated microglia play a major role in the pathogenesis in neurological disorders. The transition of microglia from the normal resting state to the activated state is associated with an increased expression of receptors known as peripheral benzodiazepine binding sites, which are abundant on cells of mononuclear phagocyte lineage. PK11195 is a ligand which binds selectively to peripheral benzodiazepine binding sites, a type of receptor selectively expressed by activated microglia in the central nervous system. The 11C-(R)-PK11195 positron emission tomography (PET) is already applied to many kinds of neurological disorders, including neurodegenerative disorders, and can demonstrate the role of neuroinflammation in the pathogenesis of neurological disorders. And this imaging modality also provides a means to monitor potential clinical relevance of antiinflammatory treatment strategies in vivo. This article reviews some of the clinical applications of 11C-(R)-PK11195 PET in the field of movement disorders.
INTRODUCTION
Microglia, which constitute 10–20% of glial cells, are the major immunocompetent phagocytic cells in the central nervous system. Microglial activation is increasingly recognized as an early step in the pathophysiological response to any form of insult, such as trauma, infection, ischemia and degenerative tissue changes.1 They respond to various kinds of insults by NMDA-mediated excitatory neurotoxicity, caspase-activation related apoptosis and have been used as an early marker.2 Activated microglia have been proposed to play a major role in the pathogenesis of a range of movement disorders including Parkinson’s disease, multiple system atrophy, corticobasal degeneration, and Huntington’s disease.1 Thus, detection of microglial activation provides useful information on formal parameters of disease, such as accurate spatial localization of the disease process and rate of disease progression. Microglial activation often procedes reactions of other cell types in the brain, and hence is a very sensitive marker of neuronal insult.3
Within the central nervous system, two pharmacologically distinct benzodiazepine receptors exist: the central and the peripheral benzodiazepine receptors. The central benzodiazepine receptor is a part of the ionotropic GABA receptor located on the plasma membrane of GABA-ergic neurons. In contrast, peripheral benzodiazepine binding sites (PBBS) is located on the outer membrane of mitochondria, mainly in glial cells.4 In the absence of invading blood-borne cells, de novo expression of PBBS occurs primarily in activated microglia. PK11195(1-[2-chlorophenyl]-N-methyl-N-[1-methylpropyl]-3-iso-quinoline carboxamide) is a selective ligand for the PBBS (Fig. 1). As a positron emission tomography (PET) radiotracer labeled with 11C, PK11195 can serve as an in vivo marker of microglial activation, as demonstrated in neurodegenerative disorders.5–15
Image Analysis of PK11195 PET
Usually the regional uptake of radioactive ligand was assessed by using a basic function implementation of a simplified reference tissue model and calculating the following rate constants: κ2, the efflux rate constant from the target tissue; and the binding potential (BP) which is a measure of ligand binding. In the reference tissue model, the reference input kinetic is usually derived from an anatomical structure that is devoid of specific ligand binding, such as cerebellum.16 However, in neurodegenerative diseases, the widespread tissue pathology may not allow the anatomical definition of unequivocally normal reference tissue. Therefore, cluster analysis was employed as an alternative approach for the extraction of normal ligand kinetic to serve as the reference input function. In brief, voxels in the raw dynamic data were segmented into 10 clusters distinguished by the shape of their concentration time- activity curves (TACs), there association each dynamic image voxel with one of the cluster curves according to the likelihood with which the TAC of the voxel belongs to a given cluster. In normal brain, the majority of voxels segregated into two clusters, one representing the TAC mainly from the skull and scalp and one representing the TAC of voxels mostly located in the cerebral cortex. The latter cluster compared with a normalized mean TAC previously created from the normal ligand kinetics from controls. Whether a TAC extracted by cluster analysis from the raw dynamic data of a patient was suitable to serve as the patient’s normal ligand kinetic was assessed by testing for dissimilarity with the previously established normal population input kinetics (χ2 test).17
Clinical Application in Movement Disorders
1. Parkinson’s Disease (PD)
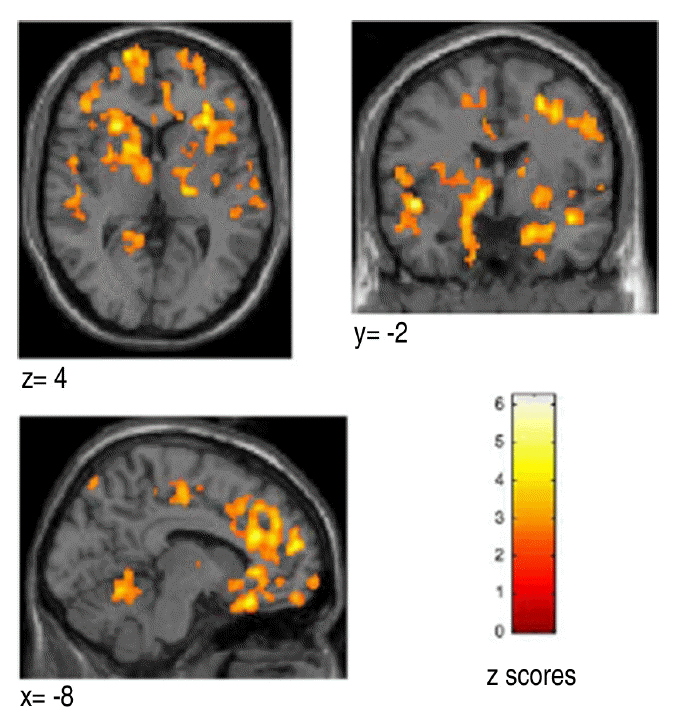
Gerhard et al. examined 18 PD patients clinically and with [11C]-PK11195 and [18F]-dopa PET. Compared to 11 normal controls, the PD patients showed significantly increased mean value of [11C]-PK11195 binding in pons, basal ganglia and frontal and temporal cortical regions. Eight PD patients remained stable over 2 years. Levels of microglial activation did not correlated with clinical severity or putamenal [18F]-dopa uptake. Their results confirmed that widespread microglial activation is associated with the pathological process in PD. They suggested the absence of significant longitudinal changes meant microglial activation was an early event in the disease process.6
2. Multiple System Atrophy (MSA)
Increased [11C](R)-PK11195 binding was primarily found in dorsolateral prefrontal cortex, putamen, pallidum, pons, and substantia nigra, reflecting the known distribution of neuropathologic changes in MSA.8
3. Progressive Supranuclear Palsy (PSP)
The main pathological finding of PSP is a neuronal loss, associated with intracellular neurofibrillary tangles and activated microglia, in the basal ganglia, brainstem nuclei, and frontal cortex. In the [11C](R)-PK11195 PET study for four patients with PSP, the PSP patient group showed significantly increased [11C](R)-PK11195 binding in basal ganglia, midbrain, the frontal lobe, and cerebellum compared to normal age-matched controls. Two of the patients were rescanned after 6 to 10 months and the level of microglial activation remained stable. [11C](R)-PK11195 PET revealed increased microglial activation in PSP patients involving cortical and sub-cortical regions that corresponds well with known distribution of neuropathological changes.9
4. Corticobasal Degeneration (CBD)
In CBD, activated microglia have been shown to be associated closely with the extensive tau pathology found in affected basal ganglia, brainstem nuclei, and cortical regions. In the [11C](R)-PK11195 PET study with four patients with CBD, the CBD patient group showed significantly increased mean [(11)C](R)-PK11195 binding in caudate nucleus, putamen, substantia nigra, pons, pre- and postcentral gyrus, and frontal lobe compared with normal age-matched controls. [11C](R)-PK11195 PET revealed increased microglial activation in CBD patients involving cortical regions and the basal ganglia that corresponds well with the known distribution of neuropathological changes, which might help to characterize the underlying disease activity in CBD in vivo.10
5. Huntington’s Disease (HD)
Pavese N et al. reported that a significant increase in striatal [(11)C](R)-PK11195 binding was observed in HD patients, which significantly correlated with disease severity as reflected by the striatal reduction in [(11)C] raclopride (RAC) binding, the Unified Huntington’s Disease Rating Scale score, and the patients’ CAG repeat index. Their findings suggested that the level of microglial activation correlated with clinical severity (Fig. 3).13 Tai YF et al. investigated microglial activation, its relationship with striatal neuronal dysfunction measured with 11C-RAC PET, and the role of PK PET as a possible marker of subclinical disease progression in HD presymptomatic gene carriers (PGCs). HD PGCs had lower striatal RAC binding than the controls but significantly higher striatal and cortical PK binding. Individual levels of higher striatal PK binding in PGCs correlated with lower striatal RAC binding and, after excluding one outlier, with a higher probability of developing HD in 5 years. The inverse association between striatal PK and RAC binding in PGCs continued to moderate stages of HD. Their study demonstrated for the first time widespread microglial activation which correlated with striatal neuronal dysfunction in preclinical HD in vivo.14
CONCLUSION
Although the exact role of activated microglia in movement disorders is not known, it has been hypothesized that they can be a bystander of neuronal death. [(11)C](R)-PK11195 PET, an in vivo marker of microglial activation, provides a potential means of localizing active brain disease. Although [(11)C](R)-PK11195 PET is not a disease specific imaging modality, it provides a valid in vivo marker of the microglial activation occurring in movement disorders. In the future, longitudinal assessment with [(11)C](R)-PK11195 PET in clinical trials could be of value in demonstrating the effects of therapeutic interventions such as neuroprotective agents.

Transverse (z=4), coronal (y=−2) and sagittal projections (x=−8) of statistical parametric maps. Between-group comparison: volumes of significant between-group differences in [11C](R)-PK11195 binding potential (BP) for the group of normal subjects and patients with Parkinson’s disease (cluster level p<0.05). The volumes are superimposed on the standard single subject MRI in SPM99 in radiological orientation. The images show increase of BP in the striatum, thalamus, cerebellum, frontal and temporal cortex.

