Quantitative Gait Analysis in Patients with Huntington’s Disease
Article information
Abstract
Objective
Gait disturbance is the main factor contributing to a negative impact on quality of life in patients with Huntington’s disease (HD). Understanding gait features in patients with HD is essential for planning a successful gait strategy. The aim of this study was to investigate temporospatial gait parameters in patients with HD compared with healthy controls.
Methods
We investigated 7 patients with HD. Diagnosis was confirmed by genetic analysis, and patients were evaluated with the Unified Huntington’s Disease Rating Scale (UHDRS). Gait features were assessed with a gait analyzer. We compared the results of patients with HD to those of 7 age- and sex-matched normal controls.
Results
Step length and stride length were decreased and base of support was increased in the HD group compared to the control group. In addition, coefficients of variability for step and stride length were increased in the HD group. The HD group showed slower walking velocity, an increased stance/swing phase in the gait cycle and a decreased proportion of single support time compared to the control group. Cadence did not differ significantly between groups. Among the UHDRS subscores, total motor score and total behavior score were positively correlated with step length, and total behavior score was positively correlated with walking velocity in patients with HD.
Conclusion
Increased variability in step and stride length, slower walking velocity, increased stance phase, and decreased swing phase and single support time with preserved cadence suggest that HD gait patterns are slow, ataxic and ineffective. This study suggests that quantitative gait analysis is needed to assess gait problems in HD.
Huntington’s disease (HD) is clinically characterized by involuntary movements such as chorea, psychiatric signs, and progressive dementia, with a prevalence of 0.38 per 100,000 people in Korea [1]. In addition, HD presents several changes in gait features, including decreased walking velocity, step initiation difficulties and variable stepping pattern [2-7]. As the disease progresses, mobility worsens not only through the development of hyperkinesia such as chorea but also through parkinsonian bradykinesia. Worsening of mobility due to gait problems is related to falls in patients with advanced HD, which further reduces functional capacity [8].
Understanding temporospatial parameters of gait in patients with HD is essential for planning a successful gait strategy, which consequently helps them avoid falls and improve their quality of daily living. Some studies have assessed gait patterns in patients with HD in North America and Europe [2,4,6,7,9,10]. The characteristic results include reduced walking speed, step length, and stride length, with increased stride time [2,6,10]. However, these studies have produced some contradictory results [2,4,6,9,10]. For example, Thaut et al. [4] did not find any evidence for a reduced cadence or stride length nor an increased stride time, and Hausdorff et al. [9] did not find any significant differences between patients with HD and controls except for a significant increase in stride-to-stride variability in gait cycle timing in patients with HD. Furthermore, there have been no studies that have assessed temporospatial gait parameters in Asian or Korean patients with HD. Previous research reported some differences between Asian HD patients and Caucasian HD patients, showing clinical differences such as a lower prevalence and higher proportion of patients without family history, and genetic differences included shorter CAG repeat length, different CAG distribution, HTT haplotype, and CCG polymorphism in Asian HD patients [1,11].
To understand gait changes in Korean patients with HD, we investigated temporospatial gait parameters using a gait analysis system and examined associations between gait parameters and clinical features using Unified Huntington’s Disease Rating Scale (UHDRS).
MATERIALS & METHODS
Subjects
We prospectively enrolled patients with HD according to the following inclusion criteria: 1) genetically confirmed HD patients (≥ 40 CAG repeat numbers in HTT gene), 2) patients were able to walk unassisted without falling during the gait study, and 3) patients were able to follow the investigator’s instructions, which meant that gait could not be influenced by cognitive or psychogenic problems. Seven patients (3 male and 4 female) with HD were re-cruited from May to December 2016 in the Korea University Guro Hospital. Control subjects were selected from our previously investigated dataset and were matched for age, sex and height with the patients with HD. Anyone exhibiting gait difficulty associated with musculoskeletal problems, previous stroke or head trauma, coexisting vestibulopathy, or significantly impaired cognition was excluded from the study. This study was approved by the Institutional Review Board of the Korea University Guro Hospital.
Assessment
Participants were characterized according to age, gender, height, weight, mini-mental status exam score, and disease duration and severity. Disease severity for the HD group was measured with the UHDRS for motor function, behavior and functional abilities: total motor score, total behavior score, functional checklist score, independence scale and total functional capacity score were measured [12]. Temporal and spatial gait characteristics of all subjects in both the HD group and the control group were measured using a gait analyzer (GaitRite. CIR system, Inc. - 12 fit AP1105; CIR systems, Franklin, NJ, USA). All participants walked at their usual speed and passed through the recording area of the gait analyzer. For each cycle, step length (cm), stride length (cm), and base of support were recorded as spatial gait parameters. Cadence (steps/min), walking velocity (cm/s), single and double support times (s), proportion in gait cycle (%GC) of single support and double support time, %GC of swing time and stance time were assessed as temporal gait parameters. Ten gait cycles were measured, and averages were calculated. For each parameter, intra-individual variability was assessed using the coefficient of variation (CoV).
Data analysis
Average values of bilateral sides were used for step length, stride length, base of support, CoV of step length, CoV of stride length, single and double support times, %GC of single and double support times, %GC of swing time and %GC of stance time. For comparisons of demographic, clinical and gait features between the HD group and the control group, Mann-Whitney U tests were used for continuous variables, and Fisher’s exact tests were used for categorical variables. For correlation analysis between UHDRS subscores and temporospatial gait parameters in the HD group, the correlation coefficients were determined using Spearman’s rank order correlation. A p-value < 0.05 was defined as statistically significant. All statistical analyses were performed with SPSS version 20.0 (IBM Corp., Armonk, NY, USA).
RESULTS
Demographic and clinical characteristics
Demographic features of all subjects in the HD group and the control group are presented in Table 1. Age, sex, height and weight did not differ significantly between groups. Clinical features of the HD group are also presented in Table 1. There was no significant correlation between age at onset and number of expanded CAG repeats in patients with HD. The number of expanded CAG repeats positively correlated with the UHDRS total motor score (Spearman’s rho coefficient = 0.861, p = 0.013) but did not correlate with the UHDRS total behavior score, functional checklist score, independence scale or total functional capacity.
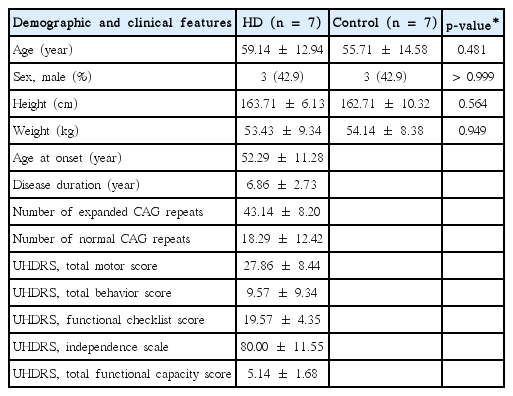
Demographic factors of HD patients and controls and clinical features of HD patients
Gait features
Most spatial and temporal parameters differed significantly between the HD and control groups (Table 2). Step and stride length were decreased and CoV of step and stride length were increased in the HD group compared to the control group. Base of support was wider in the HD group, but CoV of base of support was not significantly different between the HD group and the control group. Walking velocity was significantly decreased in HD patients. However, cadence did not differ significantly between the HD group and the control group. %GC of stance time was increased, and %GC of swing time was decreased in the HD group. Similarly, %GC of single support time was decreased in the HD group, but %GC of double support time was not significantly different between the HD group and the control group.
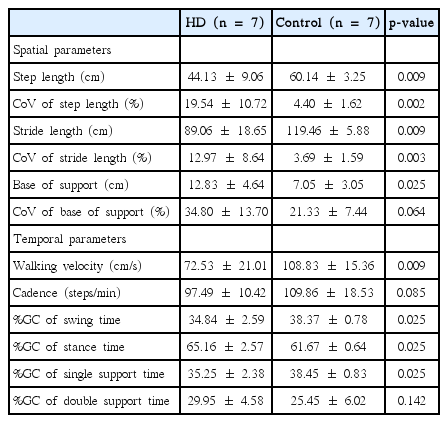
Comparison of gait parameters between the HD and control groups
The relationship between gait parameters and clinical features
The UHDRS total motor score did not correlate with any gait parameters except step length. The UHDRS total motor score and step length showed a positive correlation (Spearman’s rho coefficient = 0.764, p = 0.046). The UHDRS total behavior score positively correlated with step length (Spearman’s rho coefficient = 0.800, p = 0.031) and with walking velocity (Spearman’s rho coefficient = 0.800, p = 0.031). The other UHDRS behavior scores did not show any significant correlation with any gait parameters. All of the functional assessment subscores (functional checklist score, independence scale and total functional capacity score) did not show any significant correlation with any gait parameters.
DISCUSSION
Gait disturbance is one of the most important and critical problems in patients with HD because gait disturbance, no less than motor dysfunction and psychiatric problems, is directly connected with quality of life and safety. Studies have assessed the gait patterns of patients with HD in Europe and North America. To our knowledge, this study is the first to analyze gait patterns in patients with HD in Korea. Like most analyses from other countries, the gait pattern of patients with HD in our study differed from that of normal controls. Until now, gait studies have produced somewhat contradictory results. The key findings were that HD patients show slow, ataxic, and irregular gait. Our investigation showed similar results (Table 3). Step and stride length were sh-orter, and walking velocity was slower in the HD group. These results were in accordance with previous gait studies in HD [2,6,10]. Variabilities in spatial gait parameters (for example, step length, stride length, and base of support) were significantly increased in the HD group compared to the control group, which suggests that patients with HD have large gait-to-gait variability. Irregular and non-patterned movement in patients with HD may influence this unexpected step and gait-to-gait variability. Furthermore, increased base of support and the changes in proportion of gait cycle (increased stance and swing phase, decreased proportion of single support time) showed that patients with HD had ataxic and somewhat cautious gait features. Despite the decreased gait velocity, the cadence in patients with HD did not change significantly. Compensation for slow walking velocity and short step length would increase the cadence. This type of compensation mechanism is observed in the early stage of Parkinson’s disease [13]. HD patients might lack the compensation for low velocity and short step lengths that appears in patients with Parkinson’s disease. On the other hand, despite their normal cadence, the low velocity suggests that even if patients with HD walk eagerly, it might not be efficient.

Comparison of gait parameters between previous studies and present study
Motor dysfunction, such as chorea, dystonia, rigidity, and functional impairment, might be thought to influence gait disturbance in HD patients. In correlation analyses between the UHDRS subscores and gait parameters, the UHDRS total motor score and the behavior score both correlated with step length, which might suggest that patients with more severe motor or behavioral symptoms showed increased step length. Furthermore, the UHDRS total behavior score showed a positive correlation with walking velocity, which might mean that patients with more severe behavioral symptoms walk faster. Other gait parameters were not correlated with the UHDRS total behavior score or motor score. In addition, the functional component of the UHDRS sub-score did not correlate with any gait parameters. These results suggest that the UHDRS is insufficient to indicate the actual gait condition and strategy in HD patients. The sample size of this study was small, so interpretation of these correlation results is limited. Therefore, further studies with larger samples are needed to confirm the results of this study.
In conclusion, this study, patients with HD display some characteristic gait patterns, which were objectively assessed with a gait analyzer. Key findings from the analysis of temporospatial gait parameters show a slow, ataxic and inefficient gait without an increased cadence that would compensate for low velocity. In the future, a larger study is needed to replicate these findings.
Notes
Conflicts of Interest
The authors have no financial conflicts of interest.
Acknowledgements
We thank the patients with Huntington’s disease and the healthy volunteers for their willingness to participate in this study.