The Effect of Blood Lipids, Type 2 Diabetes, and Body Mass Index on Parkinson’s Disease: A Korean Mendelian Randomization Study
Article information

Abstract
Objective
Associations between various metabolic conditions and Parkinson’s disease (PD) have been previously identified in epidemiological studies. We aimed to investigate the causal effect of lipid levels, type 2 diabetes mellitus (T2DM), and body mass index (BMI) on PD in a Korean population via Mendelian randomization (MR).
Methods
Two-sample MR analyses were performed with inverse-variance weighted (IVW), weighted median, and MR-Egger regression approaches. We identified genetic variants associated with lipid concentrations, T2DM, and BMI in publicly available summary statistics, which were either collected from genome-wide association studies (GWASs) or from meta-analyses of GWAS that targeted only Korean individuals or East Asian individuals, including Korean individuals. The outcome dataset was a GWAS on PD performed in a Korean population.
Results
From previous GWASs and meta-analyses, we selected single nucleotide polymorphisms as the instrumental variables. Variants associated with serum levels of low-density lipoprotein cholesterol, high-density lipoprotein cholesterol, and triglycerides, as well as with T2DM and BMI, were selected (n = 11, 19, 17, 89, and 9, respectively). There were no statistically significant causal associations observed between the five exposures and PD using either the IVW, weighted median, or MR-Egger methods (p-values of the IVW method: 0.332, 0.610, 0.634, 0.275, and 0.860, respectively).
Conclusion
This study does not support a clinically relevant causal effect of lipid levels, T2DM, and BMI on PD risk in a Korean population.
Parkinson’s disease (PD) is the most common neurodegenerative movement disorder worldwide and is characterized by resting tremors, rigidity, bradykinesia, and postural instability [1]. Globally, up to 10 million people are estimated to have PD. The prevalence is rapidly increasing in aging societies, including in South Korea [2]. Given the significant social and economic burden of PD on the next generation, research has focused on identifying modifiable risk factors that can be targeted to prevent the disease [3].
Many epidemiological studies have suggested that metabolic conditions are related to PD [4,5]. Abnormal cholesterol levels, type 2 diabetes mellitus (T2DM), and obesity are risk factors that are actively being investigated for their association with PD [6-8]. However, the evidence is inconclusive, with some studies showing that these factors have a protective effect [9]. Observational studies are prone to various biases, including from unmeasured, confounding factors, which may explain the contradictory results. Mendelian randomization (MR) is a technique that can overcome these limitations [10]; specifically, by using genetic variants associated with each risk factor as proxy markers, the risk of confounding factors that can impact both the risk factor and outcome are minimized, thus enabling causality to be established.
Recently, a large-scale MR project studying more than 400 exposures as risk factors for PD was completed [11]. Exposures were derived from previous genome-wide association studies (GWASs); however, the majority of the GWASs targeted Europeans or their descendants [12]. Genetic variants are highly specific regarding ethnicity. Therefore, risk factors identified through MR studies of European populations cannot be generalized to other ethnicities. Moreover, due to the assessment of more than 400 exposures in the PD MR project, individual exposures without statistical significance were not fully discussed [11]. Given this background, we aimed to examine whether metabolic parameters (blood lipid levels, T2DM, and body mass index [BMI]) are causally related to PD development in a Korean population using MR.
MATERIALS & METHODS
Study design and data sources
MR utilizes one or more single nucleotide polymorphisms (SNPs) as the instrumental variable (IV) for the risk factor for interest (exposure) to explore the strength of association with the disease of interest (outcome) [10]. Two-sample MR analyses were performed to investigate the causal relationship between three exposures (blood lipid levels, T2DM, and BMI) and the outcome (PD). Two-sample MR uses two different study results for the IVexposure and IV-outcome associations to estimate a causal effect of the exposure on the outcome [10].
For the exposure dataset, we searched for previously reported GWASs on the three exposures by using the following criteria: 1) SNPs were reported with a p-value < 5.0 × 10⁻⁸, 2) more than ten SNPs were associated with the given exposure to avoid a weak instrumental bias, and 3) the studied population was Korean. Ideally, the samples should be drawn from the same population for two-sample MR; however, if there were no existing Korean GWAS satisfying criteria 1 or 2, we expanded the search for the exposure dataset to GWAS targeting an East Asian population, within which Korean individuals were included.
For the outcome dataset, we used summary statistics from the Korean PD GWAS by our group (Park KW, Chung SJ [2021]. Ethnicity- and Sex-Specific Genome-Wide Association Study on Parkinson’s Disease. Unpublished manuscript). The study included 1,050 sporadic Korean PD patients (age: 64.0 ± 9.7 years; 554 [53%] females; disease duration at sample collection: 5.3 ± 4.4 years) and 5,000 age- and sex-matched healthy controls (age: 64.0 ± 10.0 years; 2,610 [52%] females). All of the patients were diagnosed as having PD by movement disorder specialists via the United Kingdom Parkinson’s Disease Brain Bank Criteria.
Assumptions and gene prioritization
Due to the fact that MR uses genetic variants as a proxy for exposure, three key assumptions should be met to avoid biasing the results and to define the chosen variants as valid IVs (Figure 1). The genetic variants should be associated with the exposure (IV assumption 1), should not be associated with confounders (IV assumption 2), and should only influence the outcome through the exposure (IV assumption 3). To satisfy these assumptions, the reported SNPs in the exposure dataset were further examined as follows. First, we only included SNPs with a strong association with the exposure by setting the p-value threshold as < 5.0 × 10⁻⁸. Second, if linkage disequilibrium (LD) between a pair of SNPs was confirmed (R2 > 0.25 by using the LDlinkR package version 1.1.2) [13], one SNP of the pair was excluded, as including multiple SNPs in LD can lead to confounding effects. Third, not to violate the IV assumption 3, all of the SNPs were screened for previously reported associations with PD in the PDGene database (http://www.pdgene.org) [14], as well as in our Korean PD outcome dataset and through the identification of pathological associations via a literature search. Fourth, if a SNP was not available in our Korean PD GWAS dataset, we identified a proxy SNP in our dataset with the highest LD with the SNP (R2 cutoff of 0.8) by using LDlinkR. Finally, SNPs with strand-ambiguous alleles were excluded to rule out strand mismatches.

The framework of the Mendelian randomization analysis that was used in this study. The three key assumptions are denoted in the figure with the thick black arrow (instrument variable [IV] assumption 1) and the two red dashed line arrows with the general prohibition sign (circle with backslash in it) (IV assumptions 2 and 3). BMI, body mass index; LDL, low-density lipoprotein cholesterol; HDL, high-density lipoprotein cholesterol; PD, Parkinson’s disease; T2DM, type 2 diabetes mellitus; TG, triglyceride.
Statistical analyses
We used an inverse-variance weighted (IVW) fixed-effect method, the MR-Egger method, and a weighted median method for MR estimates. The IVW method uses a meta-analysis approach to combine the causal effect of multiple genetic variants; however, it has the potential to include pleiotropic genetic variants. The MR-Egger method provides less biased effect estimates in the presence of directional pleiotropy. Both the IVW and MR-Egger methods further assume that the pleiotropic effects of genetic variants are independent of their associations with the exposure. The weighted median method provides consistent effect estimates even when this assumption is violated.
We used Cochran’s Q-statistics and funnel plots to assess heterogeneity among the SNPs. We also performed a leave-one-out analysis to investigate whether a disproportionate influence of individual SNPs occurred in the effect estimate.
The MendelianRandomization R package version 0.6.0 was used to perform the MR estimates and sensitivity analyses [15]. All of the statistical analyses were performed with R version 4.1.2 (R Core Team [2021], R: A language and environment for statistical computing, R Foundation for Statistical Computing, Vienna, Austria, https://www.R-project.org/). p-values under 0.05 were considered to be statistically significant. The study was approved by the Institutional Review Board of Uijeongbu Eulji Medical Center (IRB #: NON2021-002). Informed consent was waived due to the fact that the study utilized publicly available summary statistics.
RESULTS
Lipid levels
We adopted IVs for lipid levels based on a previous two-sample MR study on lipid levels and ischemic heart disease in a Korean population [16]. The study performed GWAS on three serum lipid fractions (low-density lipoprotein [LDL] cholesterol, high-density lipoprotein [HDL] cholesterol, and triglyceride [TG]) measured in 35,000 Korean participants. Details of the data sources and IV prioritization process are summarized in Supplementary Table 1 (in the online-only Data Supplement). To evaluate their association with PD, we selected 11, 19, and 17 SNPs as IVs for LDL, HDL, and TG, respectively; the SNPs are listed in Supplementary Tables 2-4 (in the online-only Data Supplement).
The IVW method yielded no evidence to support a causal association between LDL levels and PD (beta = 0.009, standard error [SE] = 0.010, p = 0.332) (Table 1 and Figure 2A). The MR-Egger test also failed to show a causal association between LDL levels and PD (beta = 0.006, SE = 0.013, p = 0.682) (Table 1 and Figure 2A) without evidence of directional pleiotropy, which can be represented by the intercept deviation from zero (beta = 0.020, SE = 0.054, p = 0.712). Likewise, the weighted median approach yielded no causal association between LDL levels and PD (beta = 0.007, SE = 0.011, p = 0.518) (Table 1 and Figure 2A). Moreover, the Cochran’s Q-test showed no evidence of heterogeneity between IV estimates (Table 1), which was supported by a symmetric funnel test (Supplementary Figure 1A in the online-only Data Supplement), thus indicating no heterogeneity. The leave-one-out analysis demonstrated that no single SNP drove the IVW estimate (Supplementary Figure 1B in the online-only Data Supplement).

MR estimates of the causal effect of exposure to adverse metabolic and anthropometric conditions on Parkinson’s disease
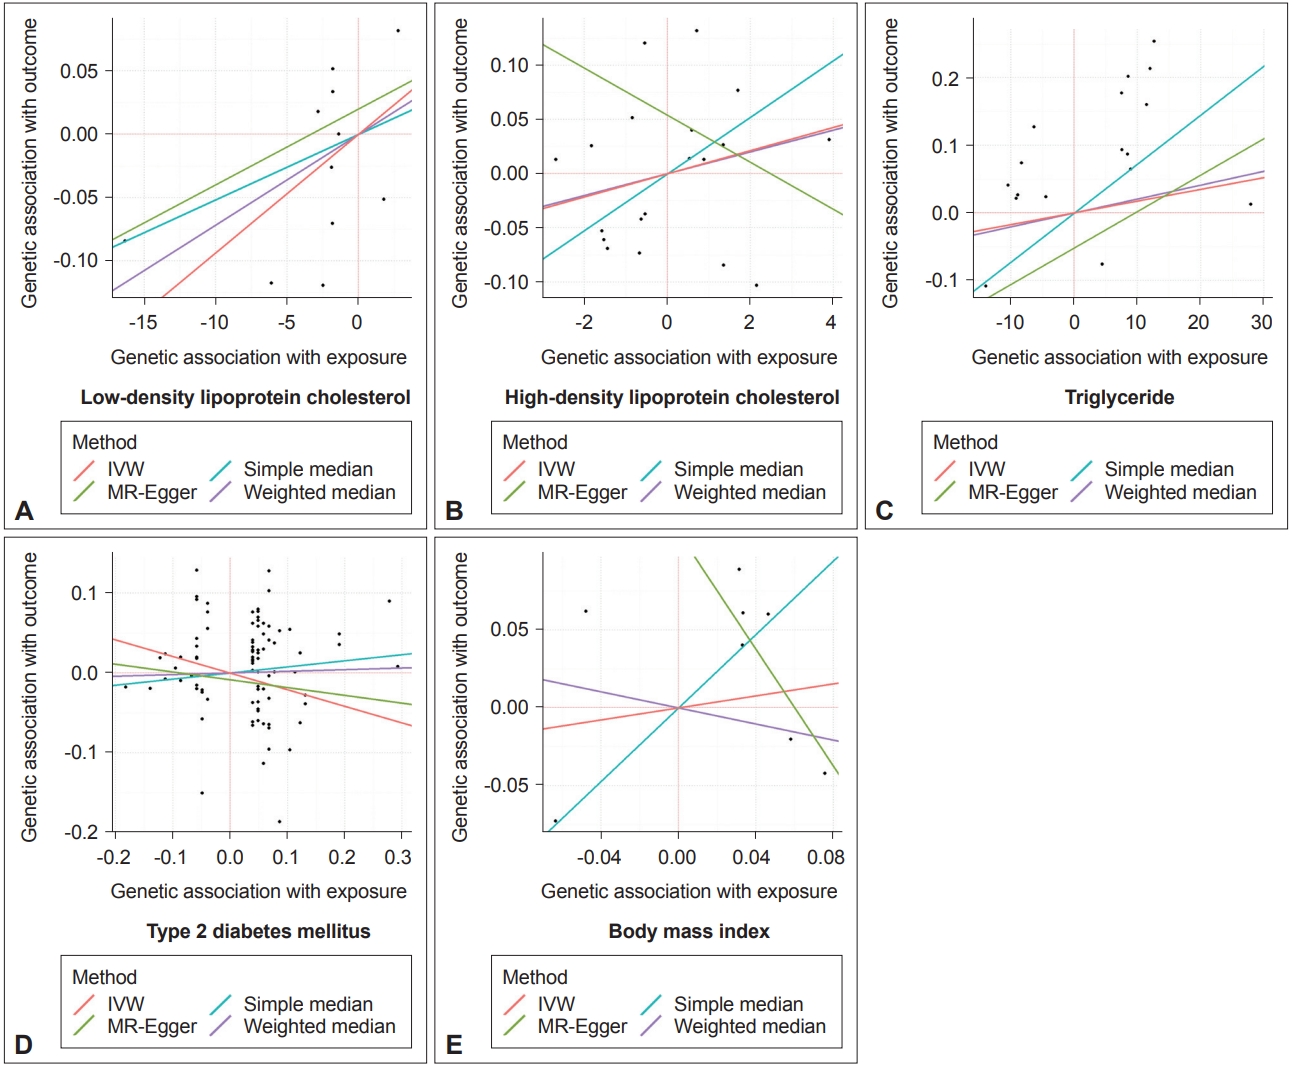
Scatter plots visualizing the Mendelian randomization (MR) estimates of the different exposures with the outcome (Parkinson’s disease). The exposures are as follows; A: Low-density lipoprotein cholesterol, B: High-density lipoprotein cholesterol, C: Triglyceride. D: Type 2 diabetes mellitus, and E: Body mass index. Inverse-variance weighted (IVW), MR-Egger, and weighted median methods are the main estimators of the analysis; a simple median estimate is shown as a reference.
Neither the IVW, MR-Egger, nor weighted median methods demonstrated evidence of a causal association between HDL levels and PD (IVW, beta = 0.011, SE = 0.021, p = 0.610; MR-Egger, beta = -0.022, SE = 0.041, p = 0.594; weighted median, beta = 0.010, SE = 0.028, p = 0.723) or between TG levels and PD (IVW, beta = 0.002, SE = 0.004, p = 0.634; MR-Egger, beta = 0.005, SE = 0.006, p = 0.403; weighted median, beta = 0.002, SE = 0.005, p = 0.656) (Table 1, Figure 2B and C). The heterogeneity tests and leave-one-out analysis showed no significant heterogeneity among the IV estimates (Supplementary Figure 1C-F in the online-only Data Supplement).
T2DM
We identified a meta-analysis that combined 23 GWASs on T2DM in 433,540 individuals from an East Asian population, which included 97,676 Korean individuals from three datasets [17]. From the summary statistics, 171 SNPs associated with T2DM with p < 5 × 10⁻⁸ (unadjusted for BMI) were initially identified as IV candidates. A total of 89 SNPs were finally selected as the IVs after the IV prioritization process (Supplementary Tables 1 and 5 in the online-only Data Supplement). The SNP rs7983505 was excluded because the proxy SNP rs2858980 (R2 with rs7983505 = 0.960) showed an association with PD in our Korean PD GWAS (p = 0.0005), although it was not associated with PD in the PDGene database.
The IVW, MR-Egger, and weighted median methods that were performed to estimate the causal relationship between T2DM and PD showed no statistically significant associations (IVW, beta = -0.208, SE = 0.190, p = 0.275; MR-Egger, beta = -0.098, SE = 0.422, p = 0.817; weighted median, beta = 0.021, SE = 0.287, p = 0.943) (Table 1 and Figure 2D). Similarly, the heterogeneity tests and leave-one-out analysis showed no significant heterogeneity among the IV estimates (Supplementary Figure 1G and H in the online-only Data Supplement).
BMI
We identified a meta-analysis that combined 21 GWASs on BMI in 134,548 individuals from an East Asian population, which included 19,325 Korean individuals from five datasets [18]. From the summary statistics, 12 SNPs associated with BMI were initially identified, and eight SNPs were included as IVs (Supplementary Tables 1 and 6 in the online-only Data Supplement).
The IVW, MR-Egger, and weighted median methods that were performed to estimate the causal relationship between BMI and PD showed no significant associations (IVW, beta = 0.193, SE = 1.098, p = 0.860; MR-Egger, beta = -1.878, SE = 3.834, p = 0.624; weighted median, beta = -0.259, SE = 1.347, p = 0.848) (Table 1 and Figure 2E). The heterogeneity tests and leave-one-out analysis also showed no significant heterogeneity among the IV estimates (Supplementary Figure 1I and J in the online-only Data Supplement).
DISCUSSION
In this study, we applied MR methods to determine the causal effect of metabolic conditions (including lipid levels, T2DM, and BMI) on PD and found that these conditions are not risk factors in a Korean population.
We found that none of the lipid markers (specifically, LDL, HDL, or TG) were associated with sporadic PD in a Korean population. Given the functional rationale and genetic evidence that brain cholesterol homeostasis is altered in neurodegenerative disorders, numerous epidemiological studies have investigated the association between serum lipid levels and PD [19]. Although earlier studies have reported mixed results with both deleterious and protective associations [20-22], a recent meta-analysis that combined 13 case–control and eight cohort studies with 980,180 subjects (including 11,188 PD patients) suggested that elevated serum levels of LDL, TG, and total cholesterol may protect against PD [23]. Lipids have been implicated in various aspects of PD pathogenesis; specifically, dysfunctional lipid binding with α-synuclein, which is the key protein involved in PD, affects the folding, aggregation, and distribution of the protein [24]. GWAS for PD validated numerous hits in lipid-associated pathways, which is represented by variants in two well-known lipid pathway genes (GBA and LRRK2). The hits in the two genes exhibit differences in prevalence and types according to the ethnicity of the target population [25-27]. In contrast to our MR results, European-targeted MR studies have shown that higher levels of LDL, TG, and total cholesterol are associated with a lower future risk of PD [6]. Such discrepancies in MR results may also support the significance of ethnicity for genetic contributions to PD in the context of lipid regulation, but more supporting evidence from East Asian populations is encouraged.
There has long been debate about the association between T2DM and PD, which share several common features. These diseases are two of the most common chronic degenerative diseases in humans, and they arise from the destruction of specific cells (such as nigrostriatal dopaminergic neurons in PD and pancreatic beta cells in T2DM). The fact that some drugs targeting T2DM seem to protect against PD has led to several epidemiological investigations [28]. One large cohort study found an increased rate of PD diagnosis following T2DM [29]. In addition, a recent comprehensive study using both meta-analyses of traditional observational studies and MR methods observed that the presence of T2DM increases PD risk [30]. However, the authors highlighted an important limitation of the study; specifically, they stated that the majority of observational data and all of the genetic data were derived from patients of European ancestry. Both T2DM and PD exhibit differences between East Asian and European descendants; for example, T2DM develops in East Asian patients at a lower BMI and a younger age and requires earlier insulin treatment compared with European descendants [31]. In Western studies, the prevalence and incidence rates of PD are higher, and male predominance is more obvious [32]. In support of these differences in a clinical context, our study suggests that the association between T2DM and PD should be investigated more thoroughly in the Eastern regions.
There are also conflicting results about the association between BMI and PD. Epidemiological studies have shown that being overweight may be a risk factor for PD [33], whereas other studies have suggested that being underweight is a risk factor for PD [8]. Moreover, the determination of the causal effect of BMI on PD is difficult due to various potential biases. For example, the presence of PD can lower BMI due to the hyposmia, change in appetite, and physical inactivity resulting from having the disease. Such a complex relationship between BMI and PD could result in the conflicting results that have been reported from traditional observational studies. Therefore, MR could be a useful method in delineating a causal association. A previous two-sample MR study focusing on European descendants found that higher BMI leads to a lower risk of PD [34]. Another large MR study investigating PD reported an inverse relationship between adiposity measures (arm fat percentage, leg fat percentage, and trunk fat mass, among other measures) and PD risk [11]. In contrast, we found no evidence to support a causal effect of BMI on PD in a Korean population. Such contradictory results may suggest that in an Asian population, body composition is not a pathogenic mechanism in PD. However, obesity is more severe in Western than East Asian societies, and individuals who have higher BMI have a higher risk of early mortality in the West; therefore, individuals with lower BMI may be overrepresented in populations with PD because of the late appearance of the disease in their lifespan. Due to the fact that the causal relationship between BMI and PD is still unclear even with MR methods, further studies to functionally clarify the relationship between adiposity and neurodegeneration are warranted.
Due to the fact that PD is one of the most common global neurodegenerative disorders, with increased social and economic burdens, efforts to identify and modify the risk factors associated with the disease have been undertaken. The most well-established risk factors for sporadic PD include age, male sex, and family history of PD, which are uncorrectable [3]. The potential effects of the three metabolic factors on PD that were investigated in our study pose great importance, due to the fact that these factors are modifiable through lifestyle and medication. Although our results do not support the causal effect of abnormal lipid levels, glucose levels, or BMI on the risk of PD in the Korean population, these conditions should be properly managed to avoid their inherent negative impacts on health. However, our study justifies the idea that these comorbid conditions do not need to be strictly adjusted in epidemiological studies on risk factors for PD in the Korean population.
There were several limitations in our study. First, the number of individuals included in the outcome database was small compared with those individuals in meta-analyses worldwide. Hence, the power of the study was relatively low, which could lead to false-negative results. However, this scenario is inevitable for genetic studies targeting a small genetic group, such as the Korean population. Further larger-scale MR targeting Korean or East Asian populations should be encouraged, along with functional studies. Second, our results showed that the presence of the investigated exposures does not alter the risk of PD, but conclusions about whether controlling the metabolic conditions in those individuals who already have the conditions would lower the risk of PD or slow the progression of PD cannot be drawn.
In conclusion, our MR analysis does not support the causal effects of abnormal lipid levels, T2DM, and BMI on the risk of PD in a Korean population. When considering the different genetic backgrounds between Eastern and Western world populations, larger MR studies targeting East Asia should be encouraged to elucidate their risk factors for PD.
Supplementary Materials
The online-only Data Supplement is available with this article at https://doi.org/10.14802/jmd.22175.
Data source informations and instrument selection process
List of instrumental SNPs to calculate the effect estimates of LDL level for PD
List of instrumental SNPs to calculate the effect estimates of HDL level for PD
List of instrumental SNPs to calculate the effect estimates of TG level for PD
List of instrumental SNPs to calculate the effect estimates of T2DM level for PD
List of instrumental SNPs to calculate the effect estimates of BMI for PD
Funnel plots (left column) and leave-one-out analysis (right column) of the MR analyses exposures. LDL (A and B), HDL (C and D), TG (E and F), T2DM (G and H), and BMI (I and J). MR, Mendelian randomization; LDL, low-density lipoprotein cholesterol; HDL, high-density lipoprotein cholesterol; TG, triglyceride; T2DM, type 2 diabetes mellitus; BMI, body mass index; CI, confidence interval; IVW, inverse-variance weighted method.
Notes
Ethics Statement
Not applicable
Conflicts of Interest
The authors have no financial conflicts of interest.
Funding Statement
This research was supported by investigator award from the Korea Movement Disorder Society (KMDS).
Author Contributions
Conceptualization: Kye Won Park, Sun Ju Chung. Data curation: Kye Won Park. Formal analysis: Kye Won Park. Funding acquisition: Sun Ju Chung. Investigation: Kye Won Park, Yun Su Hwang. Methodology: Kye Won Park, Yun Su Hwang. Project administration: Kye Won Park, Sun Ju Chung. Resources: Sun Ju Chung. Software: Kye Won Park. Supervision: Sun Ju Chung. Validation: Yun Su Hwang, Seung Hyun Lee. Visualization: Kye Won Park. Writing—original draft: Kye Won Park. Writing—review & editing: Yun Su Hwang, Seung Hyun Lee, Sungyang Jo, Sun Ju Chung.