Relationship Between the Striatal and Cerebellar Glucose Metabolism and the Response to Levodopa Treatment in Patients With Multiple System Atrophy
Article information
Abstract
Introduction:
About two thirds of the patients with multiple system atrophy (MSA) do not respond to levodopa treatment. Postmortem pathological studies and one retrospective [18F]-deoxyglucose positron emission tomography (FDGPET) study attributed such poor response to the striatal degeneration. We prospectively investigated the relationship between levodopa responsiveness and the metabolic activities of the striatum and cerebellum in MSA patients.
Methods:
In 39 patients with MSA, the UPDRS motor score was assessed and two sets of timed motor tests were perform ed before and after the levodopa treatment. After quantitative FDG PET and baseline evaluation, treatment w as started with 3 tablets of Sinemet® 25/250 mg a day. Clinical assessments were performed monthly for three months. Metabolic activities of the caudate, anterior putamen, posterior putamen, cerebellar cortex and cerebellar vermis were measured. We compared the measurements with mean percentage changes of motor function. Also, using statistical parametric mapping (SPM) analysis, we tried to find brain areas in which metabolism correlated with the clinical changes.
Results:
Mean percentage improvements of UPDRS motor scores w ere correlated with glucose metabolism in the posterior putamen and cerebellar vermis. The mean percentage improvements of performance in Purdue peg board test correlated with the glucose metabolism in the cerebellar cortex and vermis. In SPM analysis, cerebellar glucose metabolism correlated with the improvement of UPDRS motor score and the performance of two timed motor tests.
Conclusion:
The integrity of cerebellum, as well as posterior putamen, may be an important factor for showing the response to levodopa.
INTRODUCTION
In contrast to the lifelong response to levodopa treatment in most patients with Parkinson’s disease (PD),1,2 only 30% of patients with multiple system atrophy (MSA) respond to levodopa treatment.3,4 Such favorable response usually does not last longer than 3 years, and only 10% of the patients with MSA enjoy lifelong responsiveness.3,5,6 Therefore, objective measurement of the response to levodopa may provide a clue for the differential diagnosis between the two most common parkinsonian syndromes and may help to avoid unnecessary levodopa treatment.
Several postmortem pathological studies of patients with MSA reported that the response to levodopa treatment correlates with the degree of degeneration of striatal neurons.7–11 However, they were retrospective studies judged the amount of response to levodopa treatment based on the patients’ reports or physician’s impressions. An [18F]-deoxyglucose positron emission tomography (FDG PET) study showed a positive correlation between the amount of striatal glucose metabolism and the response to levodopa treatment in MSA patients.12 This was also a retrospective study in which subjective criteria for levodopa responsiveness was omitted. Here, we studied the striatal and cerebellar glucose metabolism on FDG PET studies and short-term response to levodopa treatment prospectively.
MATERIALS AND METHODS
1. Subjects
From June 2004 to December 2005, we enrolled 39 patients with MSA who fulfilled the Gilman’s diagnostic criteria of probable MSA.13 We excluded the patients who showed cerebrovascular lesions on brain magnetic resonance imaging (MRI) studies and who could not take levodopa because of the side effects. We also included 16 age matched controls for the comparison of striatal and cerebellar glucose metabolism. The written-informed consent about the invasive procedure was obtained from all subjects included.
2. Evaluation of the patients
Unified Parkinson’s Disease Rating Scale (UPDRS) motor score was measured and two timed motor tests were performed before and after levodopa treatment. We modified the Core Assessment Program for Intracerebral Transplantations (CAPIT) protocol.14 We measured the time taken to finish touching two points separated by 20 cm apart with each hand and foot for ten times. We also measured the time required to stand up from a chair, walk 5 m, turn, walk back to the chair and sit (stand-walk-sit test). For another timed motor test, Purdue peg board test was performed.15 Patients were instructed to put the pins into the holes using each hand and with both hands. Also, the task assembling the pin, washer and collar were performed with both hands. The number of pins put into holes within 30 or 60 seconds was counted, and the median number was considered a baseline measurement. Each test was repeated five times and we summed the medians of each item. For the patients who had been on levodopa treatment, dopaminergic medications were with held for 14 days for the baseline evaluation and the FDG PET scan study.
After the baseline evaluation, all patients were given 250/25 mg of levodopa with carbidopa t.i.d. and the levodopa effect was evaluated monthly for three times. One month after the levodopa treatment, follow-up evaluations were performed three hours after the morning dose of levodopa. If the UPDRS motor score at follow up did not improve, we added 250/25 mg of levodopa with carbidopa.13 The assessments of UPDRS motor score and timed motor tests were repeated two and three months after the baseline evaluation. We calculated the mean UPDRS motor scores and measurements of timed motor tests. Finally, we calculated percentage improvements of UPDRS motor scores and timed motor tests as an index of clinical improvement.
3. Quantitative brain FDG PET study
The subjects fasted overnight prior to the FDG PET scan. To minimize environmental stimuli, all procedures were performed in a quiet and dimly lit room with the patients’ eyes open. Using Allegro PET scanner (Phillips Medical Systems; gadolinium oxyorthosilicate crystals), PET scans were taken 45 to 55 minutes after injection of 0.14 mCi/kg of FDG through the antecubital vein. After 1.5 minutes of transmission, 17 minutes of emission and final 1.5 minutes of transmission scans, three-dimensional (3D) PET image was reconstructed using 3D-RAMLA (3D version of the row action maximum likelihood algorithm). The time course of [18F]-radioactivity was obtained with repetitive sampling of radial arterial blood for 40 minutes after the administration of FDG. Finally, 3D parametric PET image representing absolute glucose metabolism was acquired using a software PMOD version 2.61 (PMOD technologies Ltd., Zurich, Switzerland) with FDG-autoradiography method (lump constant=0.437, k1=0.102, k2=0.13, k3=0.062, k4=0.0068).16
4. Analysis of local cerebral metabolic rate of glucose
1) Statistical parametric mapping (SPM)
We used SPM2 (Welcome Department of Cognitive Neurology, Institute of Neurology, London, UK) software implemented to MATLAB 7.0 (MathWorks, Natick, MA) for the analysis of PET data. PET images were spatially normalized and smoothed with 10 mm of full width half maximum (FWHM). Using simple correlation method in the SPM2, we searched significant brain regions in which the glucose metabolism correlated with the degree of levodopa responsiveness.
2) Template volume of interest (VOI)
To minimize examiner error, we adopted the template VOI drawn in the Montreal Neurological Institute 152 (MNI152) template brain image. Cylindrical VOIs with a 5 mm diameter were drawn at caudate, anterior putamen and posterior putamen and cylindrical VOIs with a 7 mm diameter at cerebellar vermis and medial and lateral cerebellar cortex. A set of VOIs was overlaid on the spatially normalized individual PET image and the regional cerebral metabolic rate of glucose (rCMRglu) was calculated.
RESULTS
1. Characteristics of patients
The mean (±SD) age of 16 controls (61.0±4.0 years; range = 54 to 70) were not significantly different from that of 39 patients with MSA (64.5±10.0 years; range: 44 to 84). The mean age at onset was 62.2±9.8 years (range: 40 to 82) and the mean duration of disease was 29.6±16.0 months (range: 2 to 60). All the patients showed both parkinsonism and cerebellar deficits. The predominant clinical feature was parkinsonism (MSA-P) in 24 patients and cerebellar deficits (MSA-C) in 15 patients. Nineteen of the 39 patients had never been treated with dopaminergic medications. At baseline, the mean UPDRS motor score was 26.1±9.6 (range: 4 to 44).
2. Improvement of UPDRS motor scores and timed motor tests
The effects of the levodopa on UPDRS motor score were variable. The score worsened in about half of the patients. The mean percentage improvement of UPDRS motor score was 1.0±22.8% (range: −54.8 to 41.7). The UPDRS motor score improved by more than 30% in only three (7.7%), by 20 to 30% in four (10.3%) and by 10 to 20% in nine patients (23.1%).
The mean percentage improvement in measurements of modified CAPIT test was 4.1±21.8% (range: −48.6 to 56.0), and the measurements improved by more than 30% in four (10.3%), by 20 to 30% in three (7.7%) and by 10 to 20% in ten patients (25.6%). The mean percentage improvement in measurements of Purdue peg board test was 14.0±22.9% (range: −36.9 to 62.3), and the measurements improved by more than 30% in ten (25.6%), by 20 to 30% in three (7.7%) and by 10 to 20% in six patients (15.4%). There was a correlation between the improvements of the two timed motor tests (Pearson’s correlation; r=0.662, p<0.001). The improvements of both timed motor tests also correlated with that of UPDRS motor score (Pearson’s correlation; modified CAPIT test vs. UPDRS motor score: r=0.331, p=0.04; Purdue peg board test vs. UPDRS motor score: r=0.383, p=0.016).
3. Comparison of rCMRglu of striatum and cerebellum between the patients with MSA and normal controls
The rCMRglu values of all measured VOIs of patients with MSA were significantly lower than those of controls. When we divided the patients with MSA into the MSA-P and MSA-C and compared each group with controls, both groups of patients showed significantly lower rCMRglu values in all VOIs than those of controls (Fig. 1).
Scatter diagram of the regional cerebral metabolic rate of glucose (rCMRglu) of striatum and cerebellum. The independent t-test was applied for the comparison of the rCMRglu values between in patients with MSA and in controls. Upper and lower bounds of vertical bars indicate two standard deviations of rCMRglu values. The middle horizontal lines of vertical bars indicate the mean rCMRglu values.
4. Brain regions correlated with the clinical improvements analyzed by SPM2
The improvements in Purdue peg board tests correlated with the glucose metabolism in the cerebellar cortex and vermis (uncorrected p<0.001). When we adopted the level of significance at uncorrected p<0.01, the improvements of UPDRS score and modified CAPIT test by the levodopa treatment showed tendency of correlation with the glucose metabolism of the cerebellar cortex and vermis (Fig. 2).
Brain regions in which glucose metabolism correlates with the degree of clinical improvement (SPM projection). (A) Improvement of UPDRS motor score (uncorrected p<0.01), (B) Improvement of the measurements of modified CAPIT test (uncorrected p<0.01), (C) Improvement of the measurements of Purdue peg board test (uncorrected p<0.001). Thresholded at the spatial extent of clusters above 100 voxels.
5. Correlations between the clinical improvements and the rCMRglu of striatum and cerebellum analyzed by template VOIs
The percentage improvements of UPDRS motor scores correlated with the glucose metabolism in posterior putamen (Pearson’s correlation; r=0.334, p=0.037) and cerebellar vermis (r=0.446, p=0.004). The improvements in Purdue peg board tests correlated with the glucose metabolism in the cerebellar cortex (r=0.421, p=0.008) and vermis (r=0.445, p=0.005). However, the improvements of modified CAPIT tests did not correlate with the striatal or cerebellar glucose metabolism (Fig. 3, Table 1).
Scatter diagram showing the correlation between the improvements of UPDRS motor scores and Purdue peg board tests and the measurements of regional cerebral metabolic rate for glucose (rCMRglu). (r; Pearson’s correlation coefficient, p; p-value.)
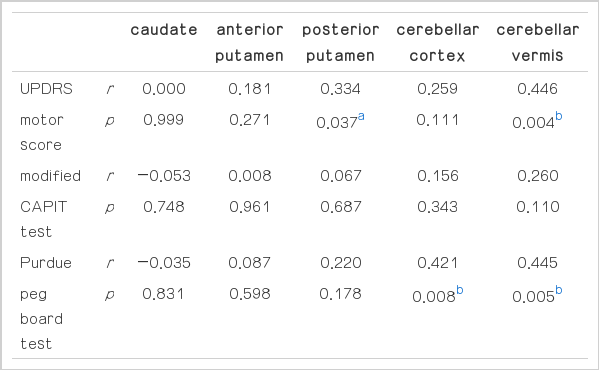
Correlation between the clinical improvements and the glucose metabolisms in the striatum and cerebellum
DISCUSSION
1. Striatal glucose metabolism and the responsiveness to levodopa
The akinesia of the parkinsonian rats induced by 6-hydroxydopamine responded well to levodopa treatment. Subsequent intrastriatal injection of quinolinic acid to destroy the striatal neurons ameliorated the beneficial effect of levodopa treatment.17 Also, in non-human primates with 1-methyl-4-phenyl-1,2,3,6-tetrahydropyridine (MPTP) induced parkinsonism responded to levodopa treatment. Subsequent chronic administration of 3-nitropropionic acid abolished levodopa responsiveness.18
In retrospective clinicopathological studies of the patients with MSA, poor levodopa responsiveness has been attributed to the degeneration of the striatal neurons.7–11 There were several patients with MSA who showed levodopa induced dyskinesia and excellent response to levodopa treatment for up to 9 years. They had minimal striatal damage in postmortem pathological studies.19–22 Therefore, the integrity of the postsynaptic striatal neuron was thought to be associated with the responsiveness to levodopa treatment.
In accordance with the previous animal studies and clinicopathological reports, the present study showed a correlation between the improvement of UPDRS motor score and the rCMRglu of the VOI of posteriorputamen. However, there was no correlation between the improvement in the two timed motor tests and the anterior or posterior putaminal glucose metabolism. Also, SPM analysis did not show correlation between striatal glucose metabolism and improvement of UPDRS motor score.
According to the multiple tracer study in patients with MSA, the severity of parkinsonian motor deficits inversely correlated with the uptake of the [11C]-raclopride in the putamen. In contrast, an FDG PET scan study of nine patients with MSA did not show a correlation between the striatal glucose metabolism and the degree of parkinsonian motor deficits.23 In the present study, we also could not find any correlation between the UPDRS motor score and the glucose metabolism in the putamen.
2. Cerebellar glucose metabolism and the responsiveness to levodopa
Most previous clinicopathological reports focused on the degree of striatal pathology and the responsiveness to levodopa treatment.7–11 In the present study, cerebellar glucose metabolism was associated more closely with clinical improvement after levodopa treatment than that of the striatum. In a postmortem pathological study, patients with striatonigral degeneration (SND) type MSA showed favorable response to levodopa treatment more frequently than those with olivopontocerebellar atrophy type MSA. Also, in MSA patients with similar degree of SND pathology, those with higher grade cerebellar damage responded less well to levodopa treatment.24
The presence of akinesia was inversely related to the cell loss in the inferior olive, pontine nuclei and cerebellar cortex.3 Although the patients with MSA-C also had SND pathology, they usually do not exhibit parkinsonian features corresponding to the degree of damage to the striatum.24 In such patients, parkinsonian rigidity seemed to be offset by cerebellar hypotonia.25 In contrast, patients with cerebellar deficits may show delayed initiation and execution of movement similar to those with basal ganglia damage.26 In patients with MSA, the cerebellar damage may augment parkinsonian clumsiness and slowness of movement, which certainly influence UPDRS motor score and timed motor tests. Such cerebellar bradykinesia may not be improved by the levodopa treatment. Therefore, the amount of the improvement of parkinsonian motor deficits observed in MSA with cerebellar dysfunction may be decreased by those reasons.
3. Conclusion
Although we could not find consistent results in all assessments of motor function, the integrity of cerebellum as well as the posterior putamen may be necessary for the levodopa effect on motor function in patients with MSA.